Test the operation before you commit the capital.
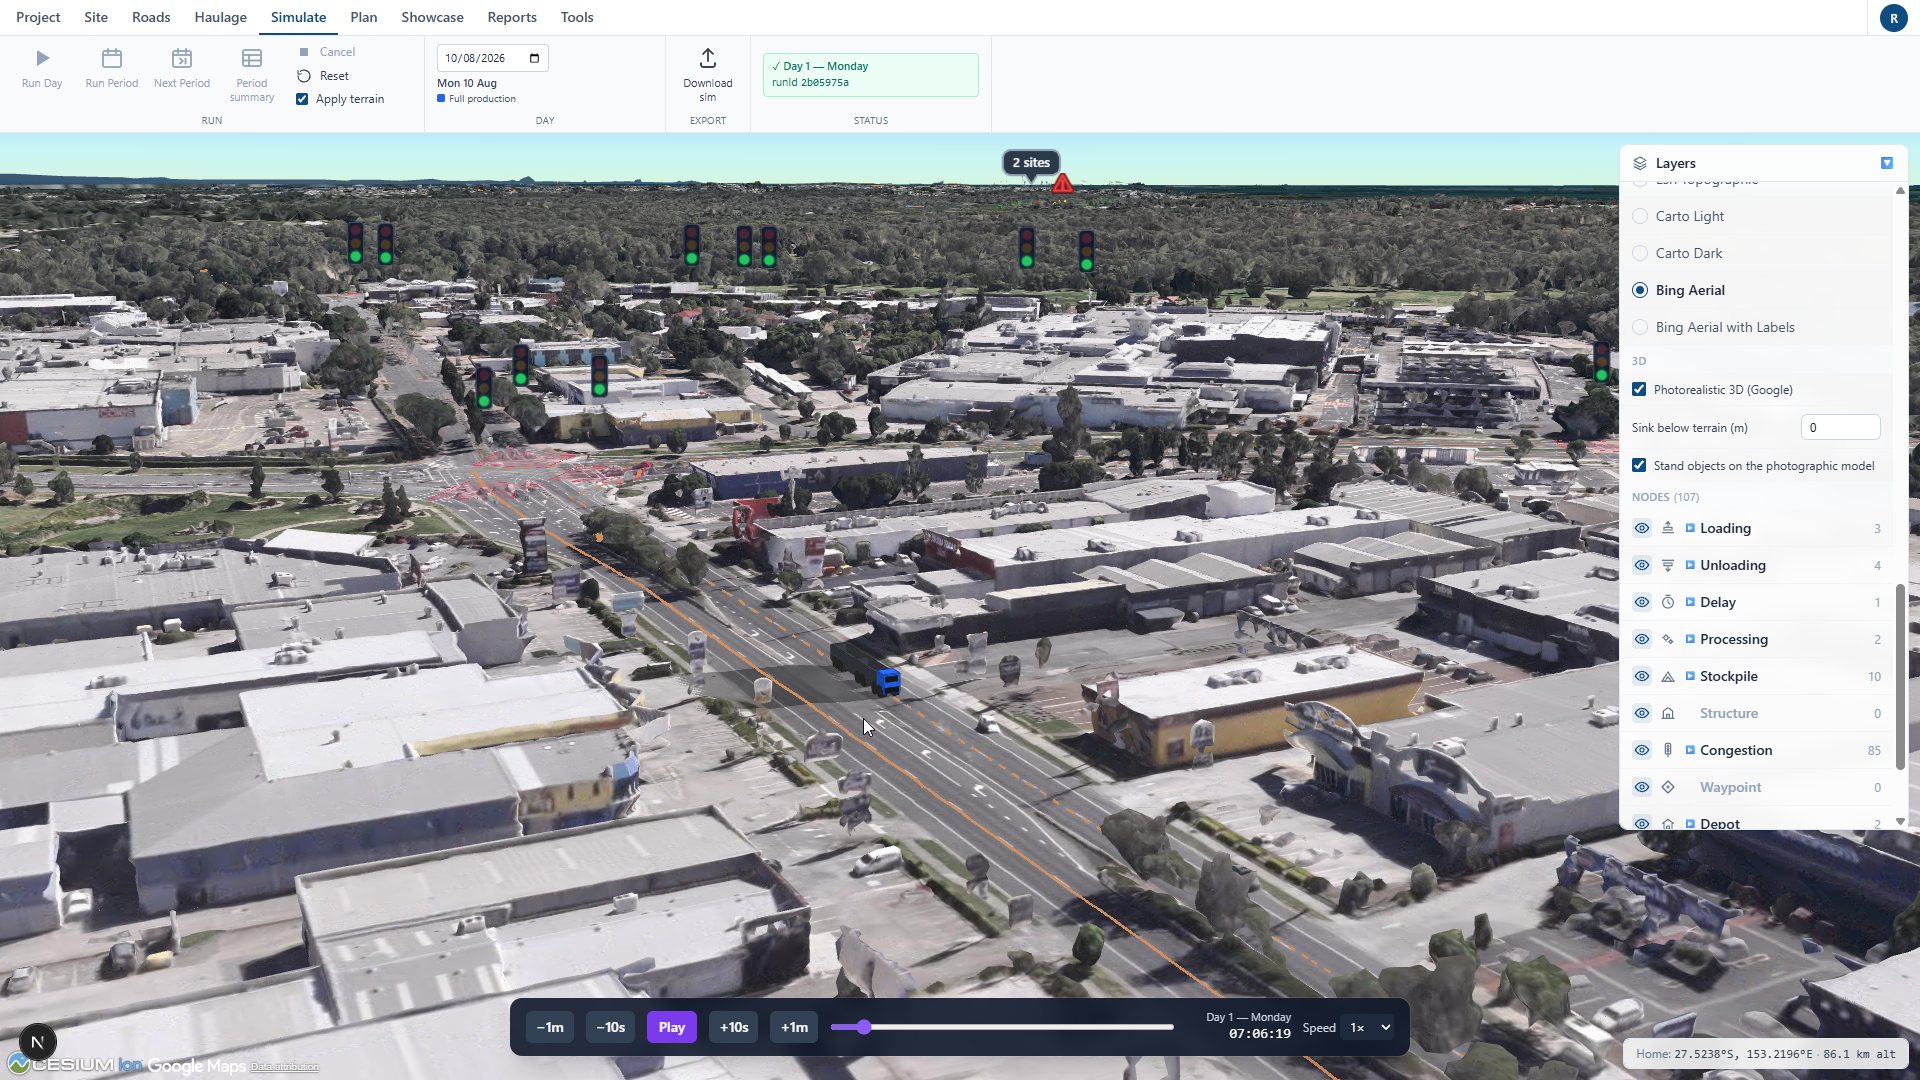
LuminFlow models routes, fleets, plants and constraints on a 3D globe, then simulates a full day of operations second by second. Built for engineers, planners and operators who need fast, defensible answers about capacity, throughput and cost.
How it works
Model. Simulate. Decide.
01
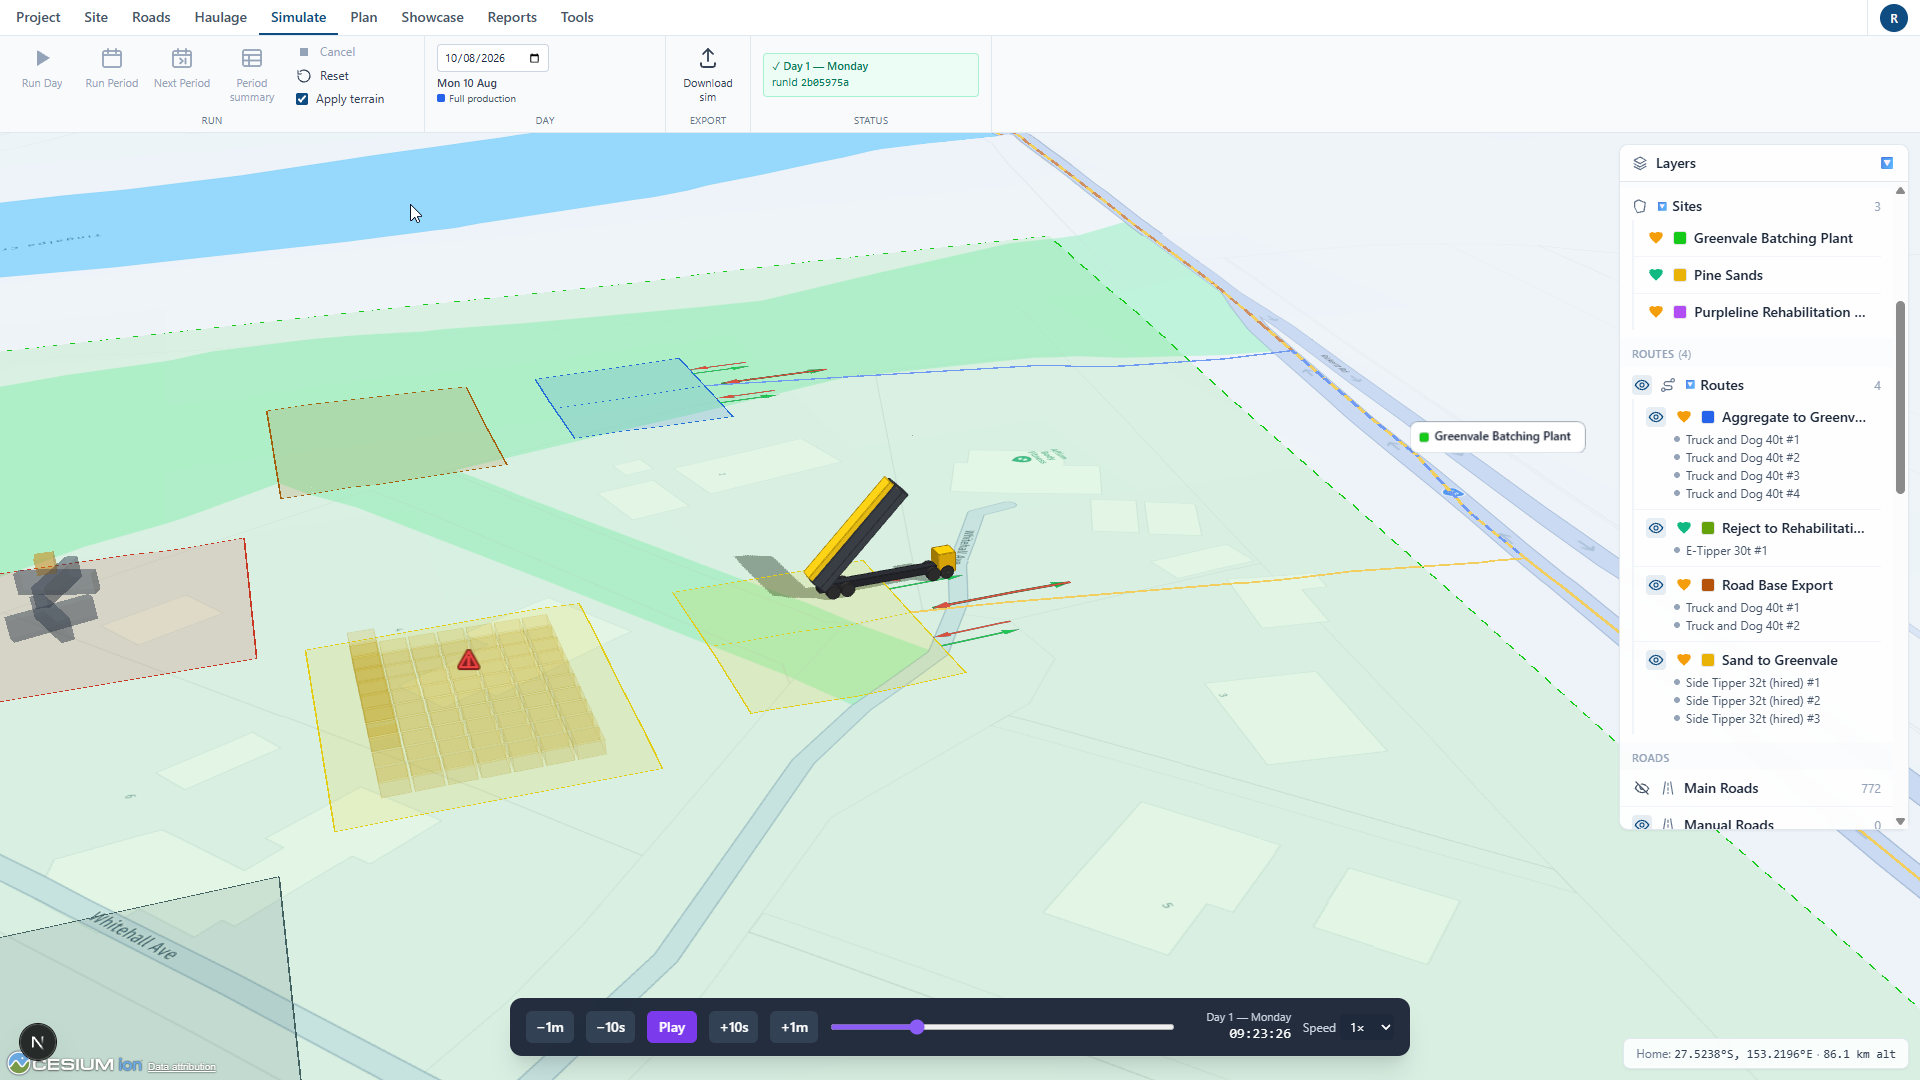
Model your operation
Draw sites, nodes and roads straight onto the 3D globe. Configure materials, trucks, loaders and the haulage plans that connect them.
02
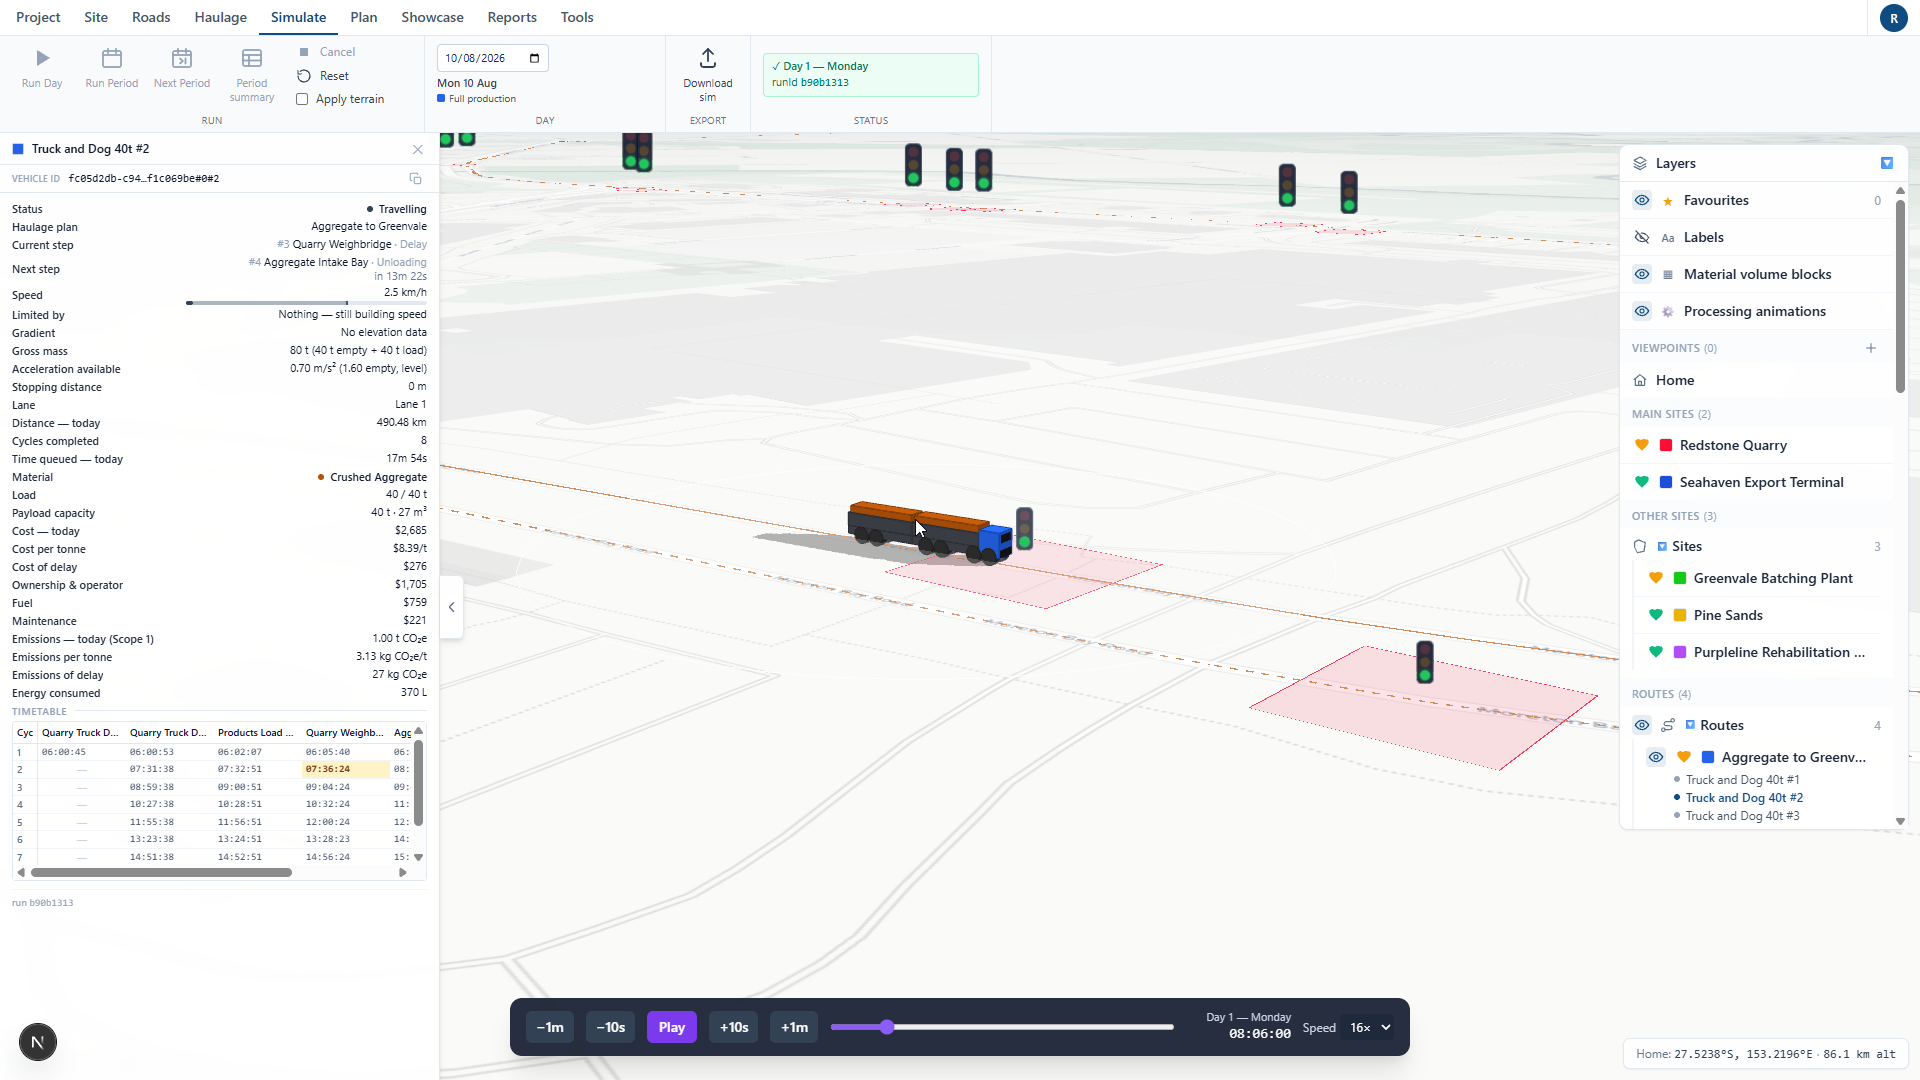
Simulate the day
Run a full day second by second: loading, hauling, queueing, weighing, unloading. Watch it play back over real terrain and inspect any truck live.
03
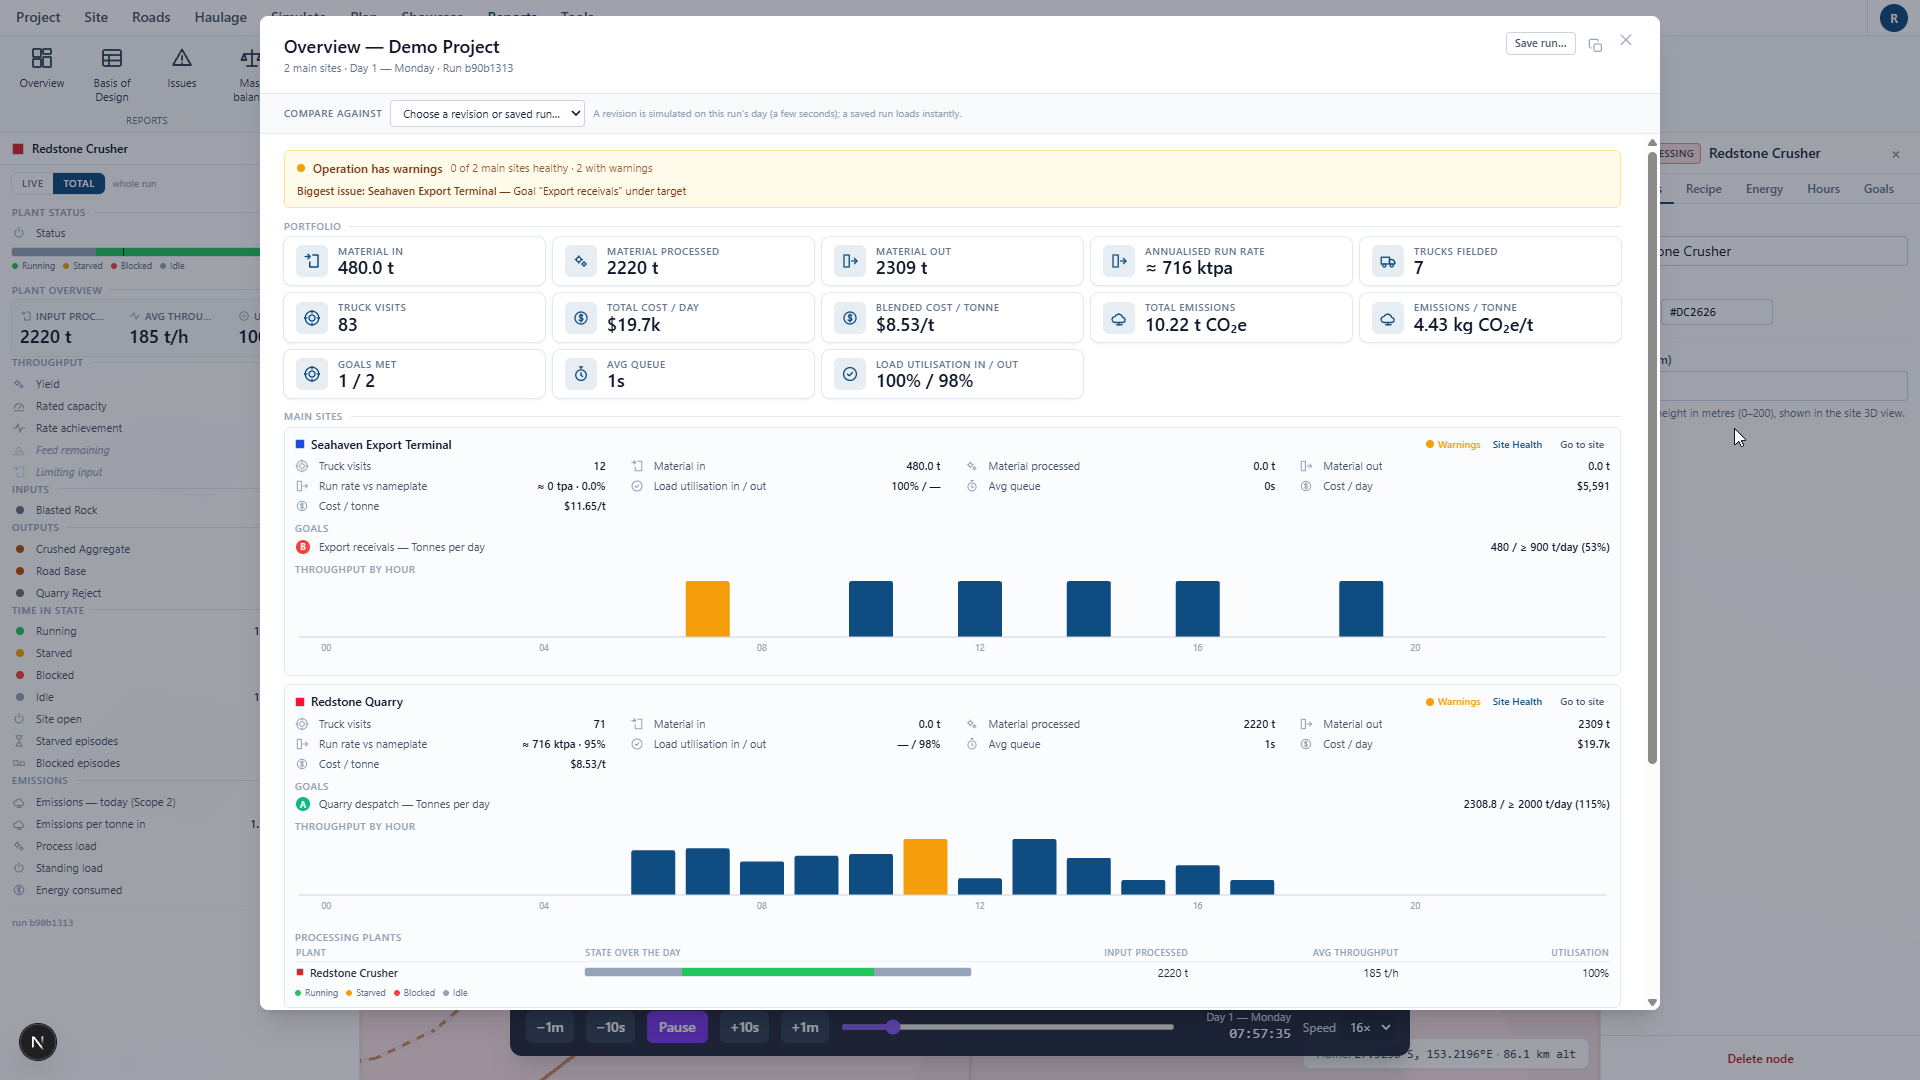
Decide with numbers
Throughput, cost per tonne, emissions, queues and goals in one overview, with mass balance reports that name the constraint and price every fix.
Under the hood
Depth where it matters
Route health
Deterministic cycle analysis with no simulation required: distance, cycle time, payload binding and where the minutes go.
Mass balance
Supply, transport and demand for every material chain. Whichever is smallest is what actually moves.
Plant telemetry
Running, starved, blocked and idle time for every processing plant, with yield and rated capacity.
Planning horizons
Compose simulated day types into a quarter or a year. Every headline figure traces back to a day that actually ran.
Cost and emissions
Dollars per tonne and CO2e per tonne on every run, split by fleet, processing and delay.
Real-world context
HERE road networks, real terrain and Google photorealistic 3D put the model in its actual surroundings.
A usable model in an hour, not a fortnight.
Ask better questions sooner. Draw the site, describe the cycles, run the day.