The platform
What is LuminFlow?
LuminFlow is a geospatial scenario simulation tool for asset-heavy operations. Draw a real site on a 3D globe: its boundaries, loading points, weighbridges, stockpiles, plants and the roads between them. Describe the vehicle cycles and the fleet that works them. Then simulate a full day of operations, second by second.
The output is animated playback on the globe plus a deep set of throughput, utilisation, queueing, cost, emissions and material-flow metrics. It sits between a digital twin, a GIS system and a discrete-event simulation package, and its purpose is decision support: test operational decisions before capital is committed.
Decision support
The questions it answers
01 · Model
Draw the operation, don't code a model
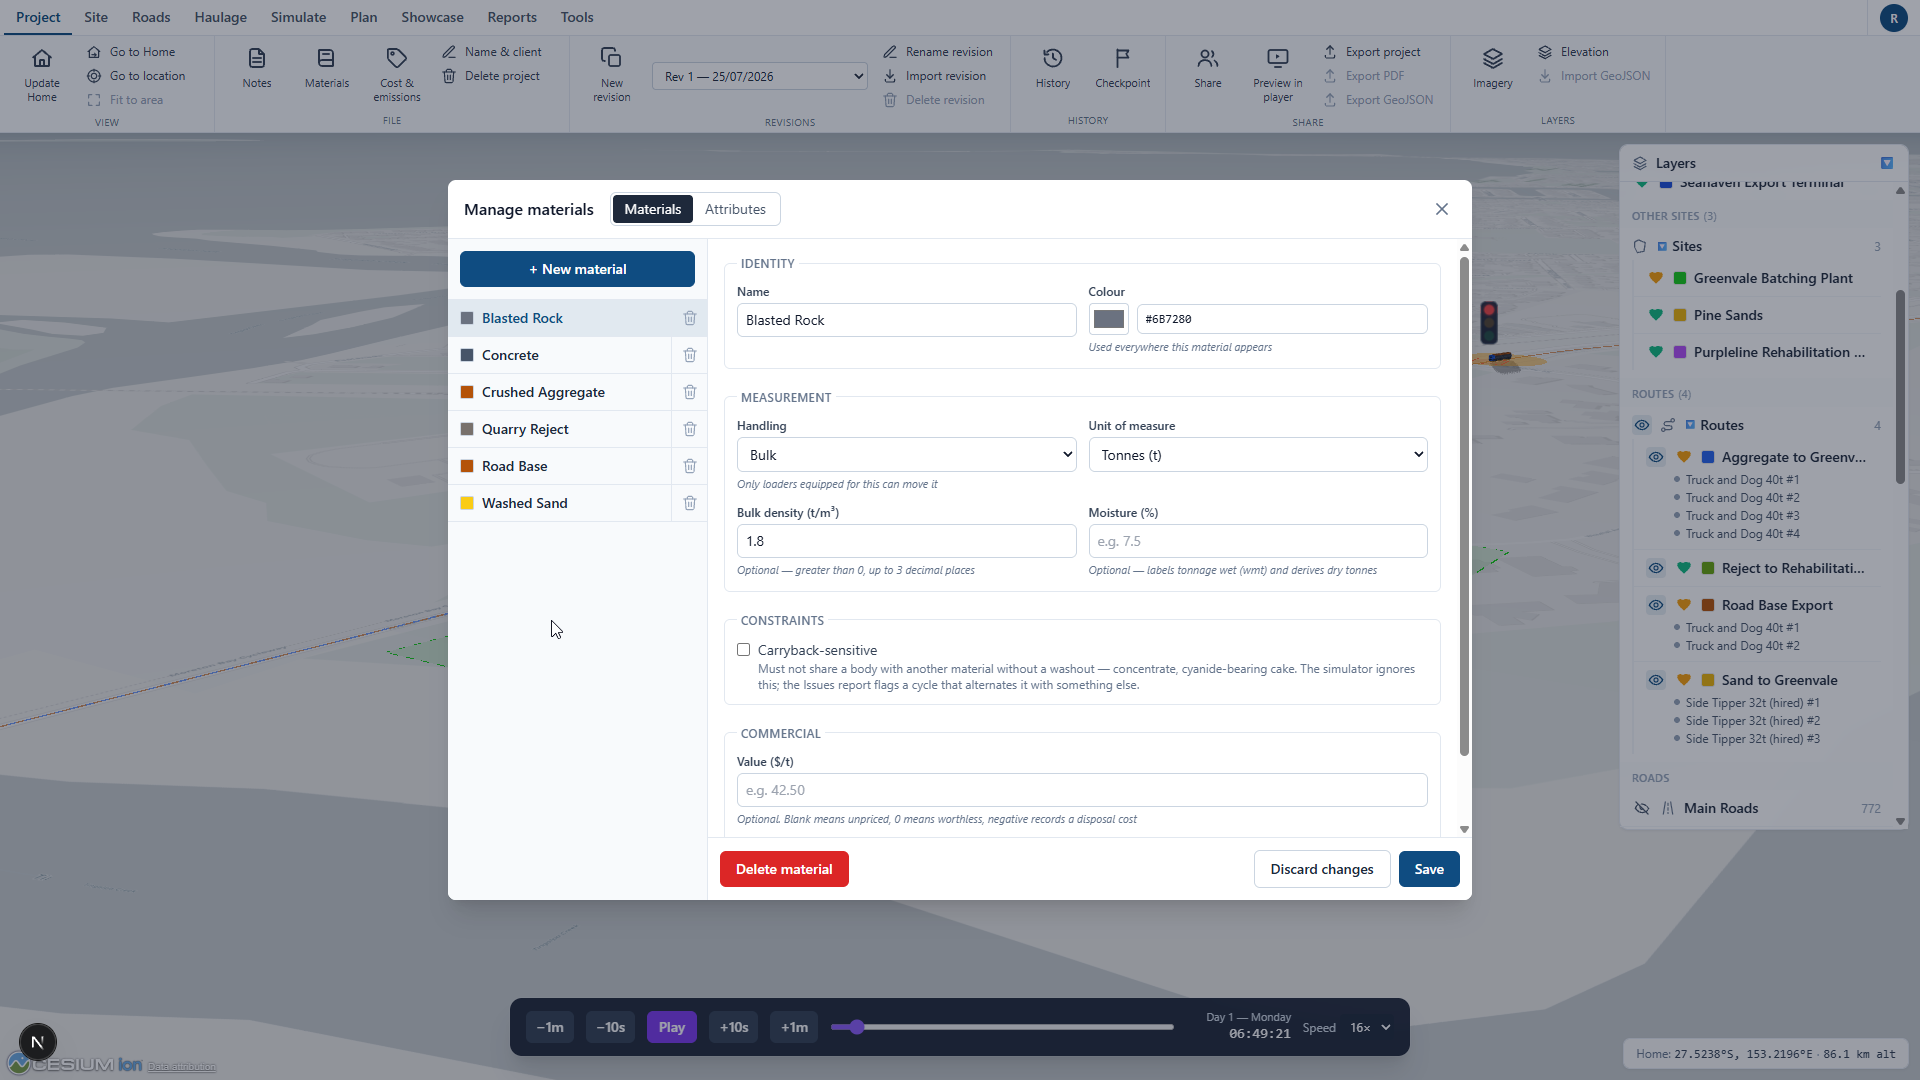
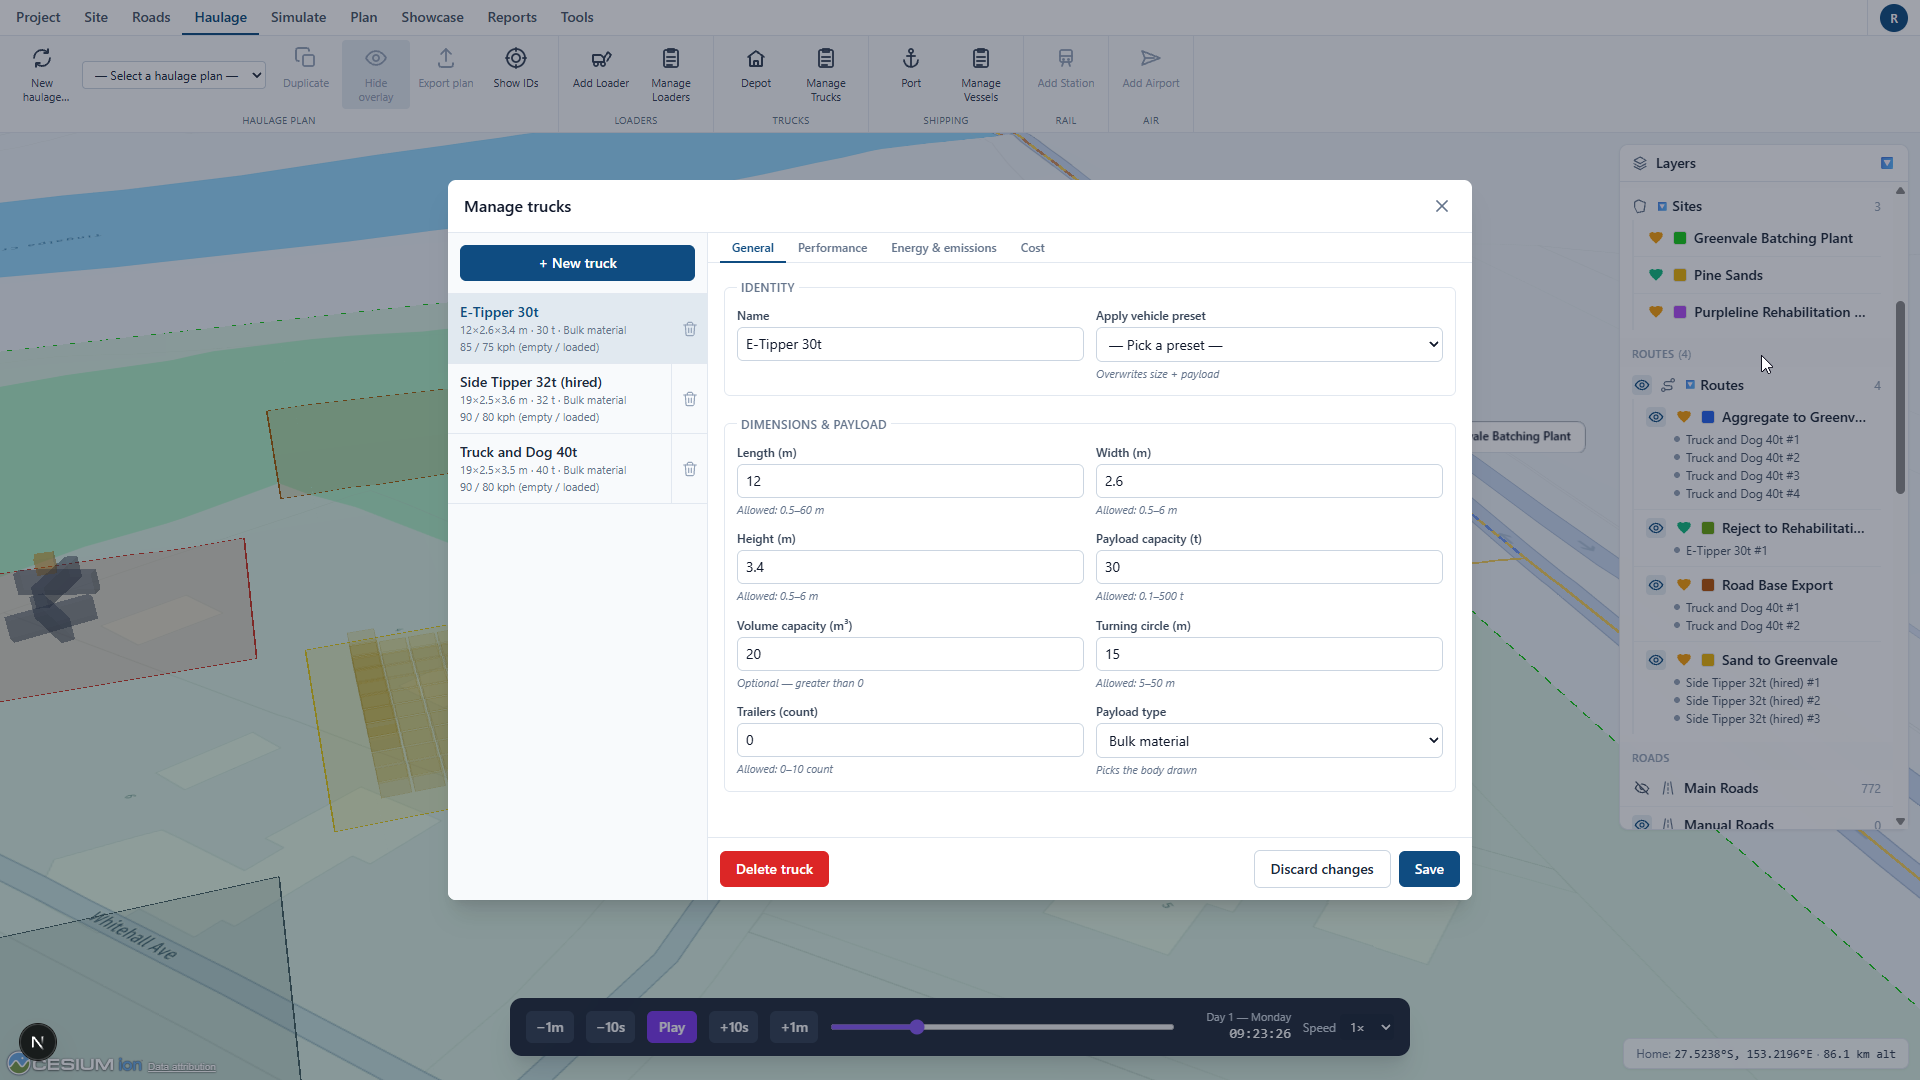
A usable model takes an hour, not a fortnight. Sites, nodes and roads are drawn straight onto the globe, and everything else is configured in place: materials, trucks, loaders and the haulage plans that connect them.
- Sites with operating hours, speed limits and goals; nodes for loading, unloading, weighbridges, stockpiles and processing plants.
- Materials with bulk density, moisture and value per tonne; stockpiles render as true material volume blocks.
- A truck library with dimensions, payload, speeds, energy and cost, plus loaders and hired fleet.
- Road networks imported from HERE or drawn by hand, at regional scale down to individual lanes.
02 · Simulate
A full day of operations, second by second
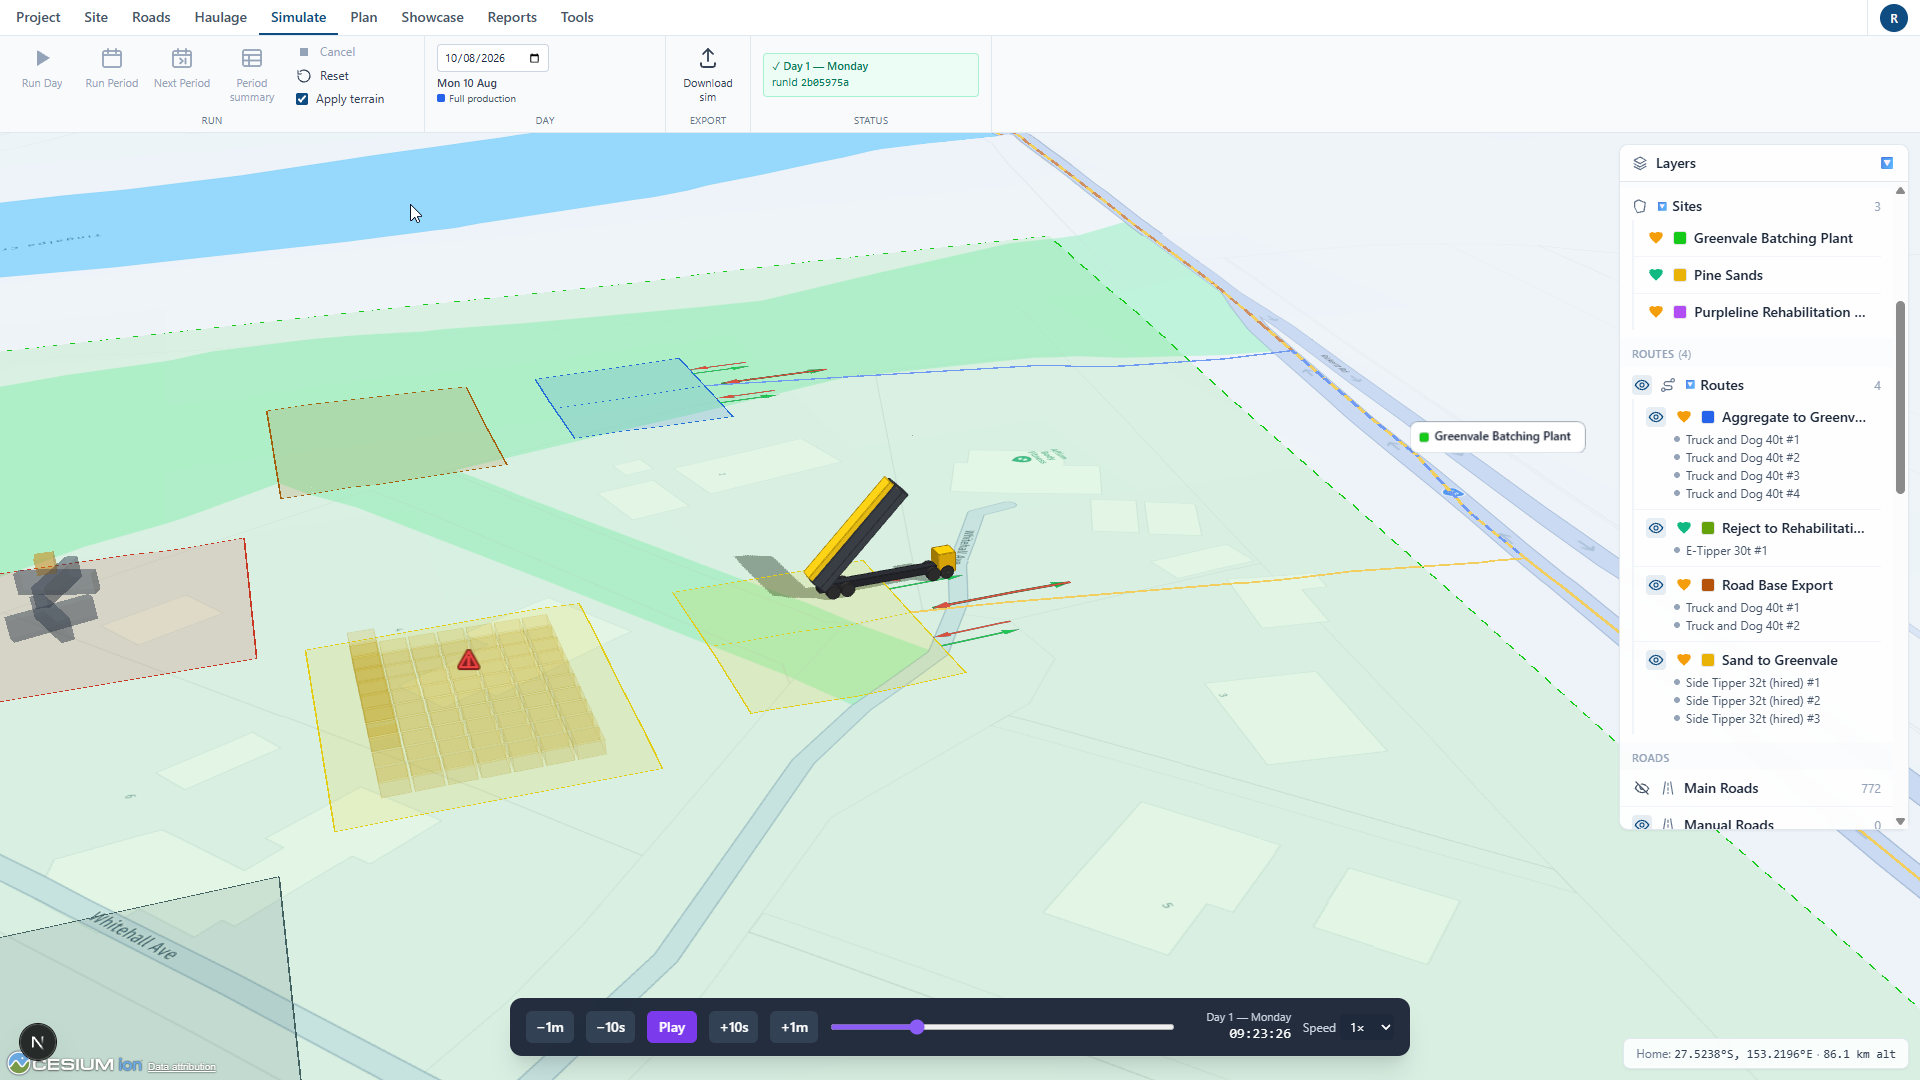
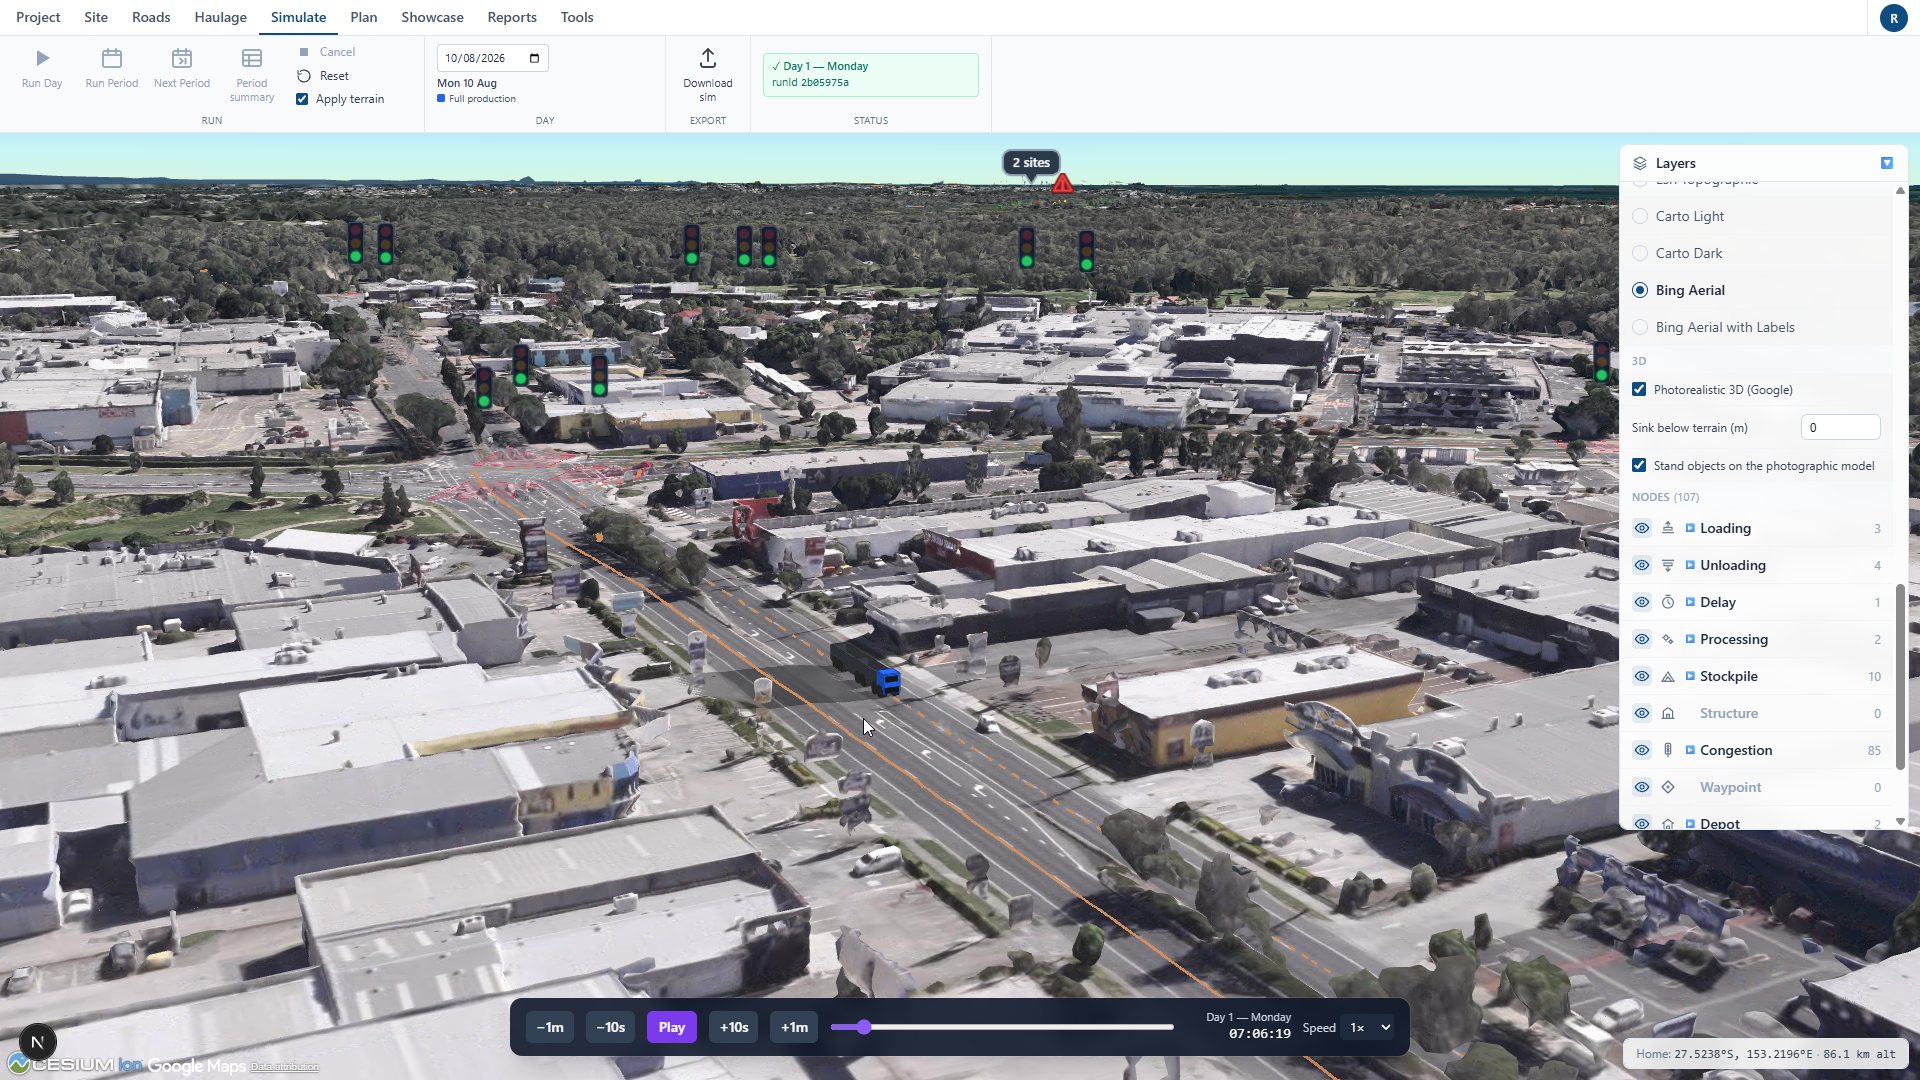
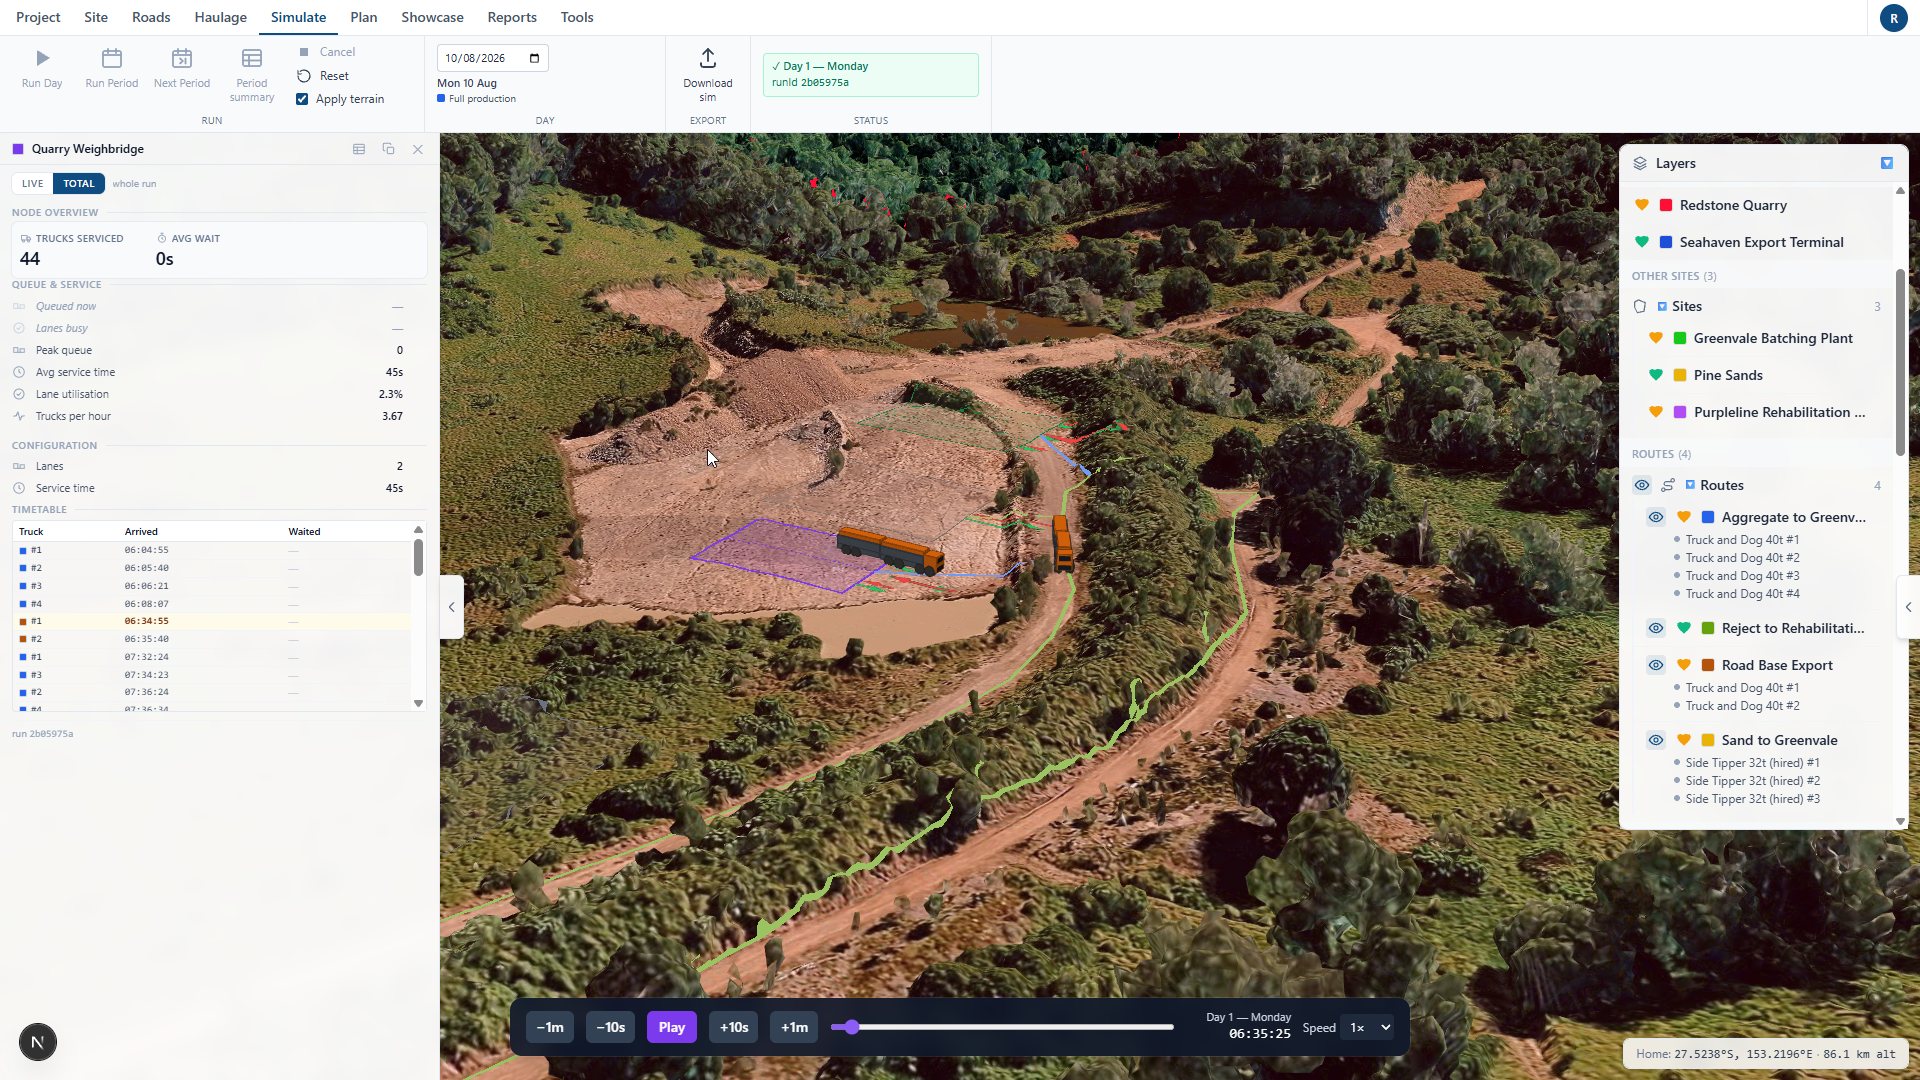
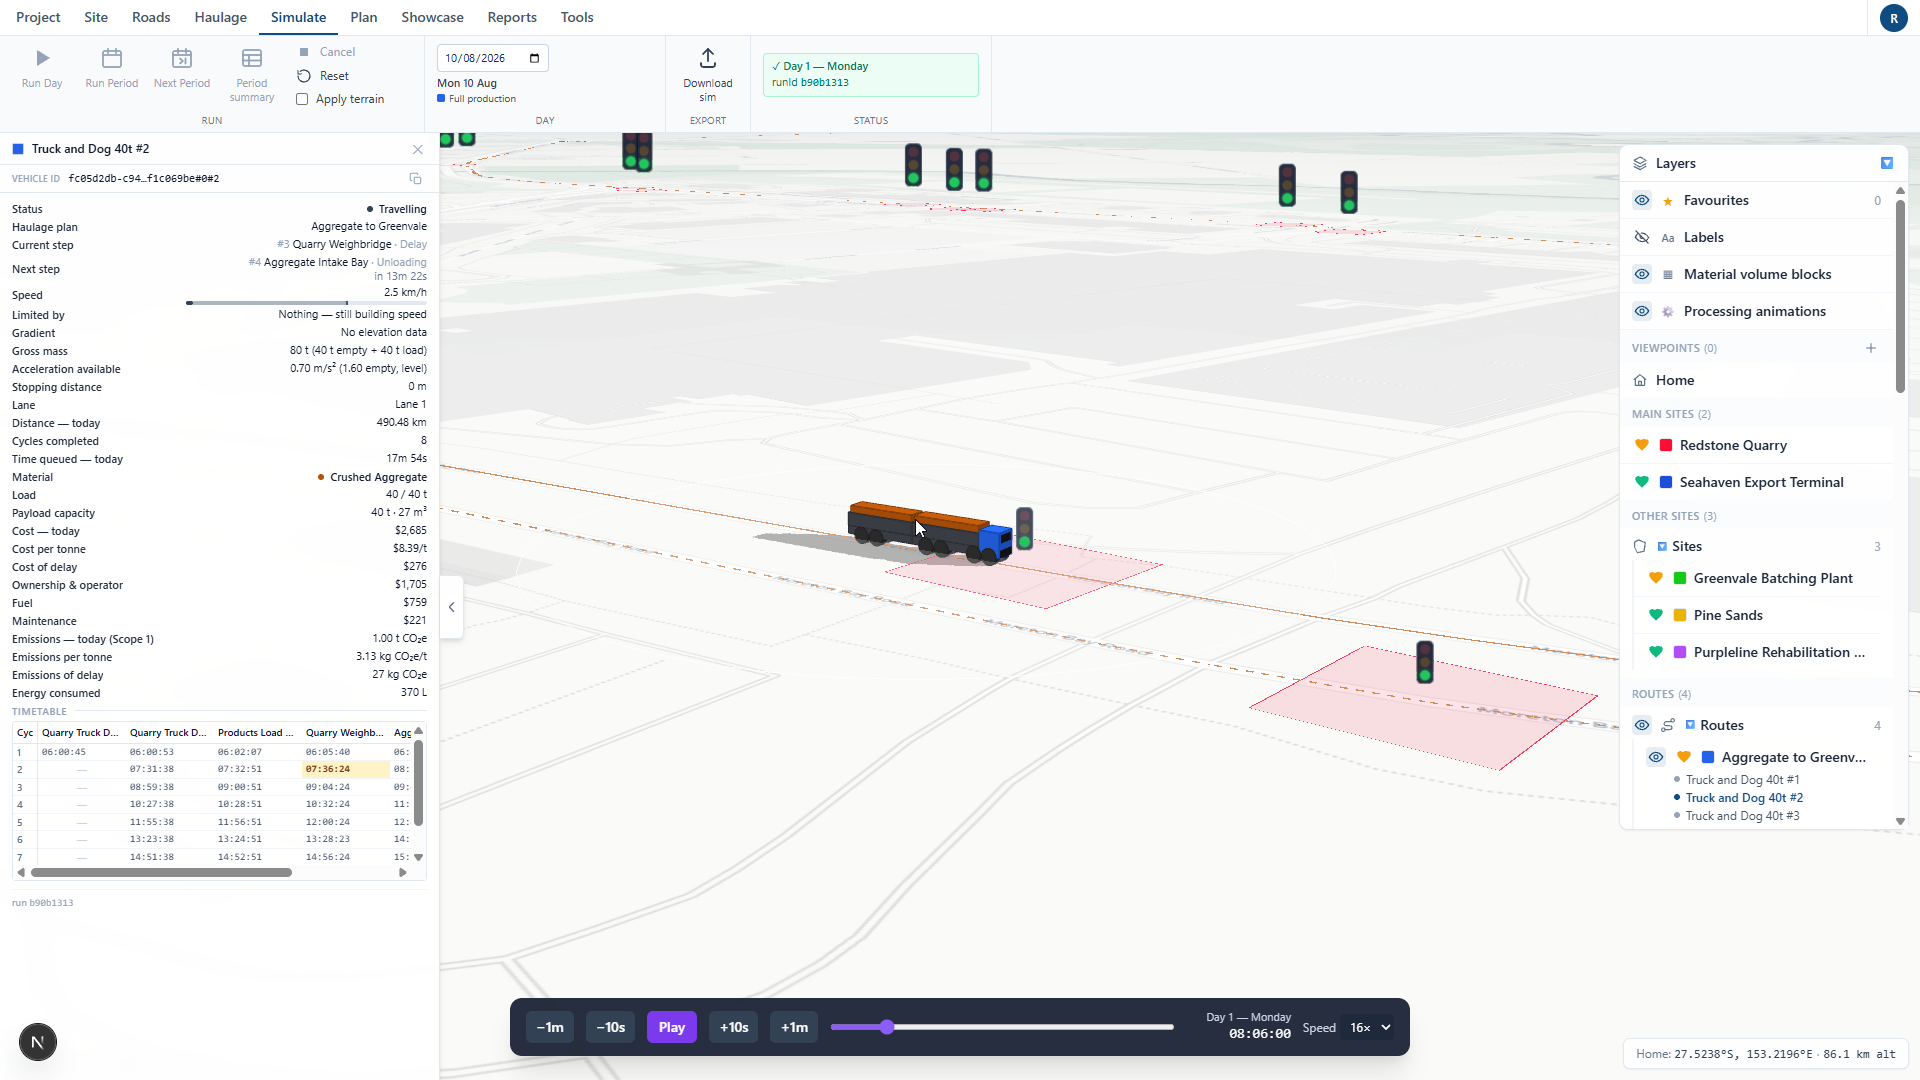
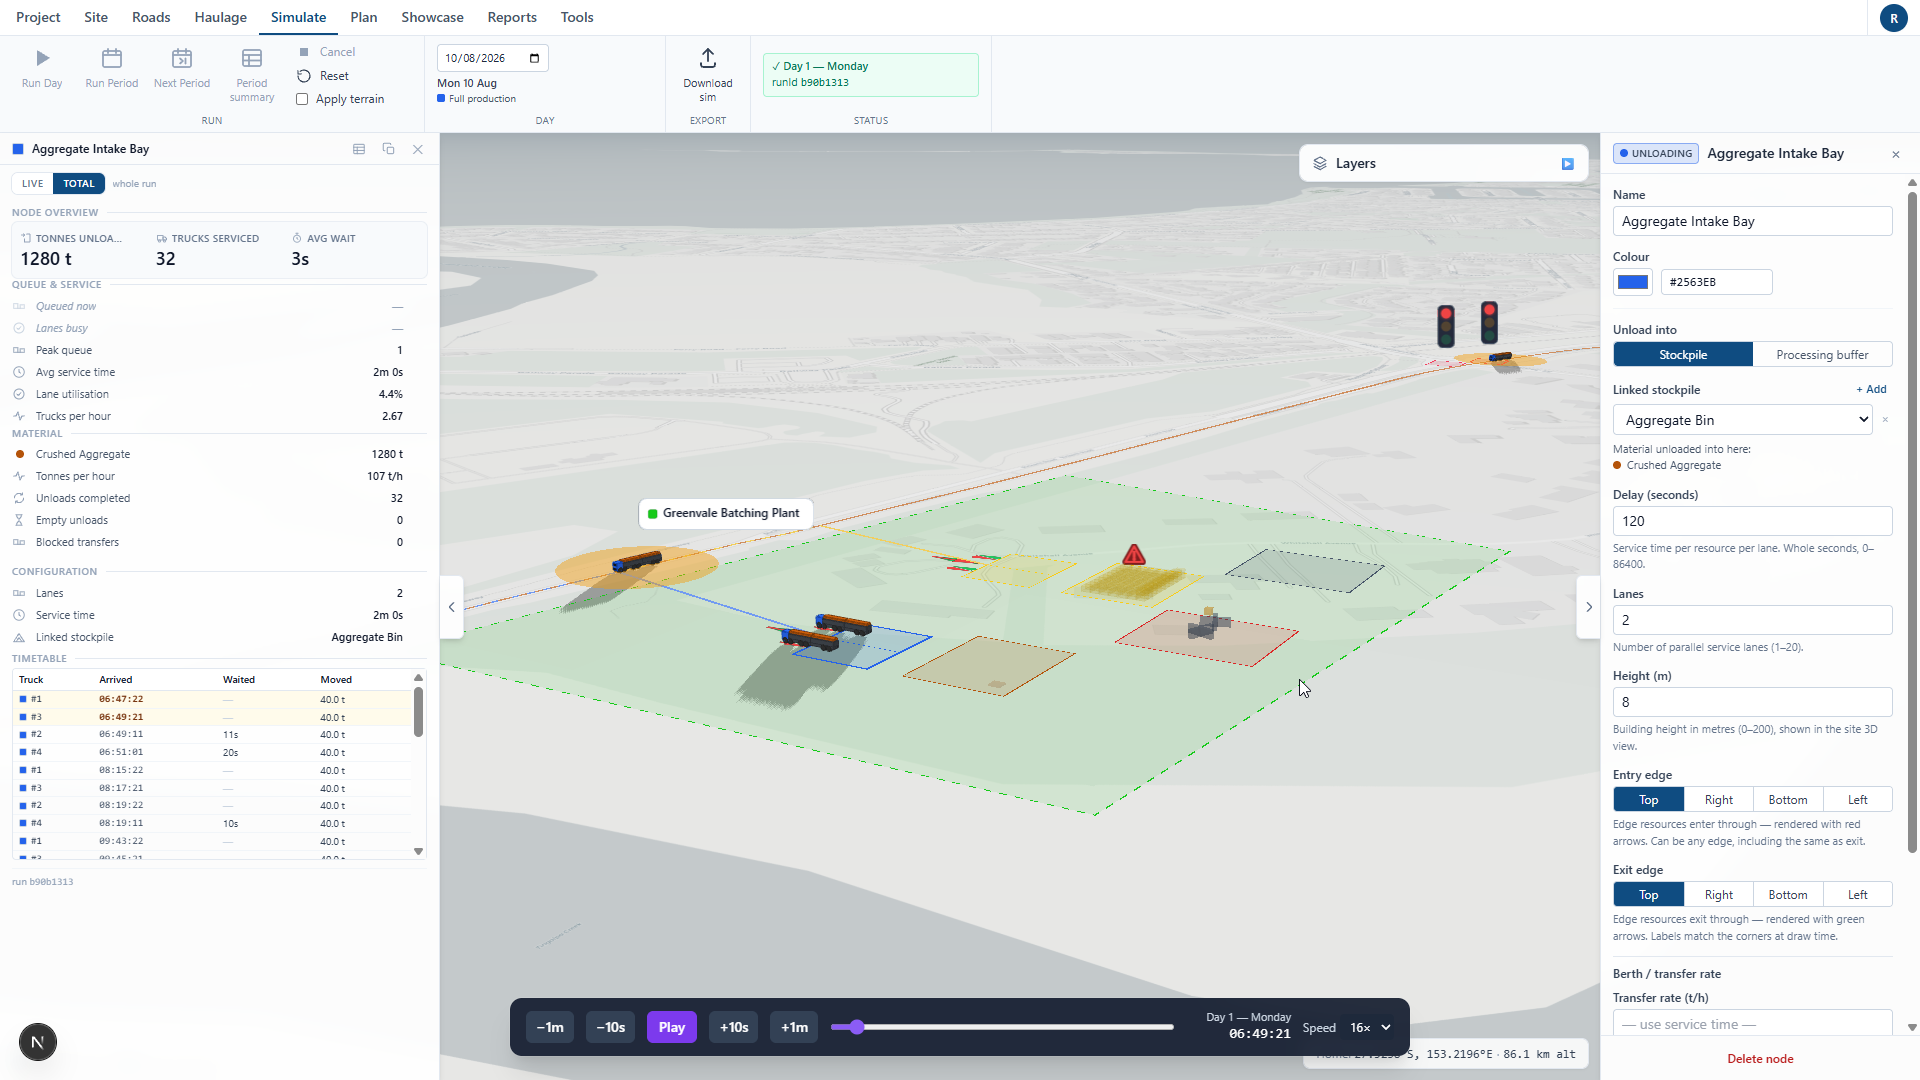
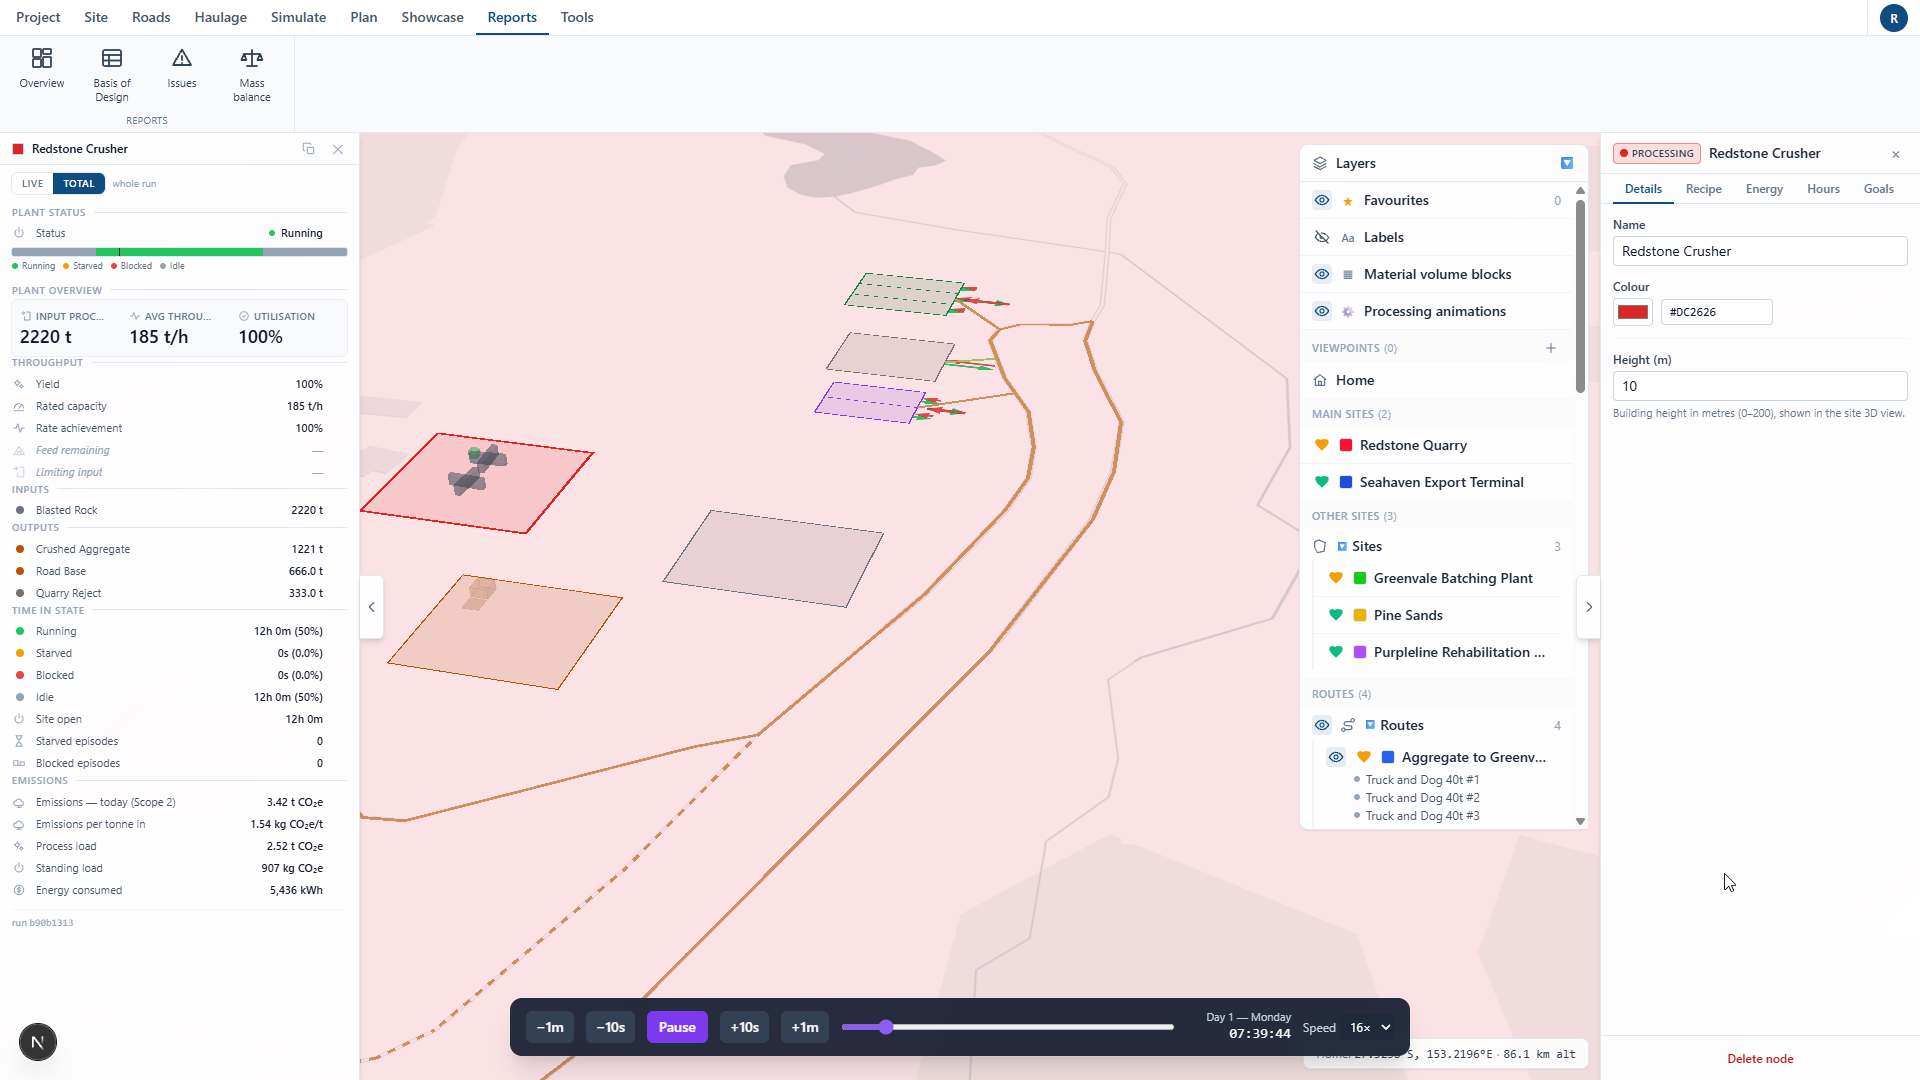
The simulator runs every truck through its cycles for a whole day: loading, hauling, queueing, weighing, unloading. Playback is animated on the globe, over real terrain and photorealistic 3D, and every vehicle and node can be inspected live.
- Deterministic playback with traffic lights, congestion, queues and give-way behaviour.
- Follow a single truck: its current step, speed, load, cost to date and full cycle timetable.
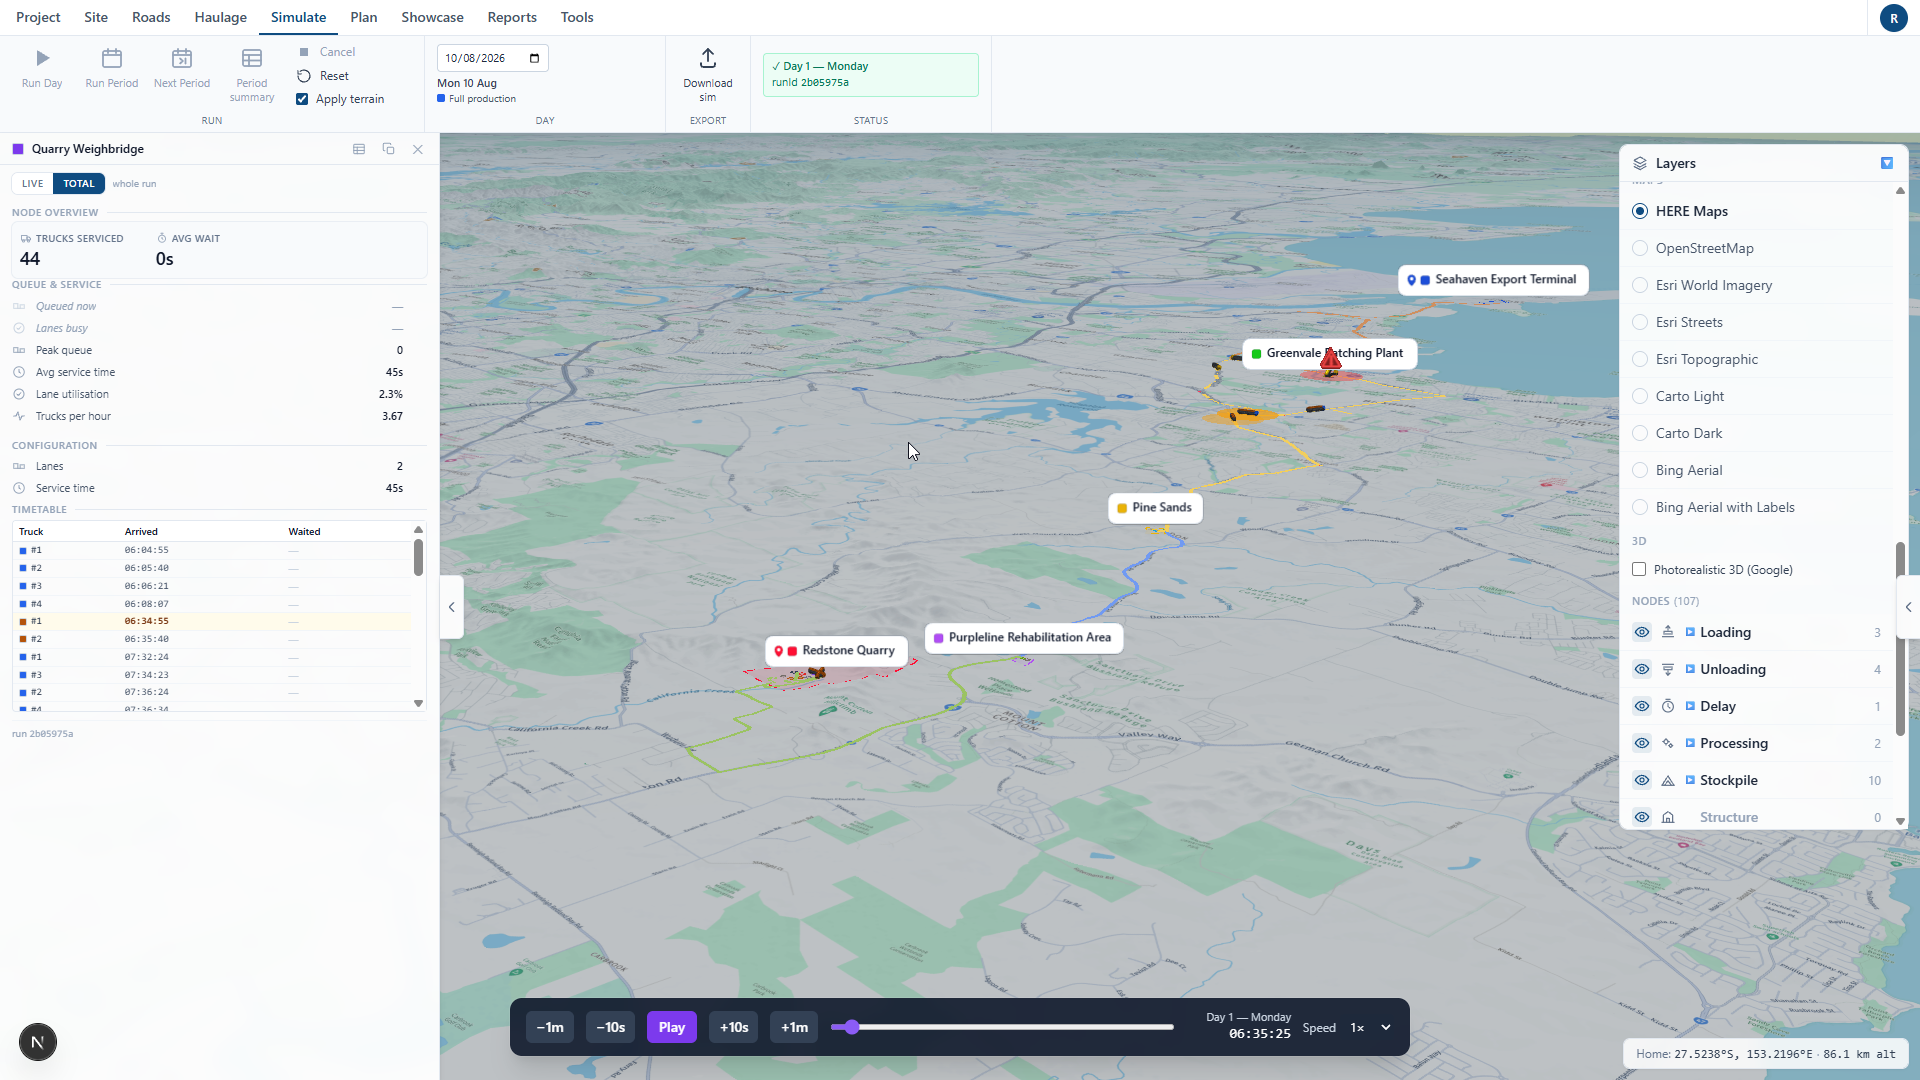
- Open any node during playback: lanes, service times, peak queues and arrival logs.
- Real street networks and Google photorealistic 3D tiles put the operation in its actual surroundings.
03 · Understand
Reports that say what binds, and what it is worth
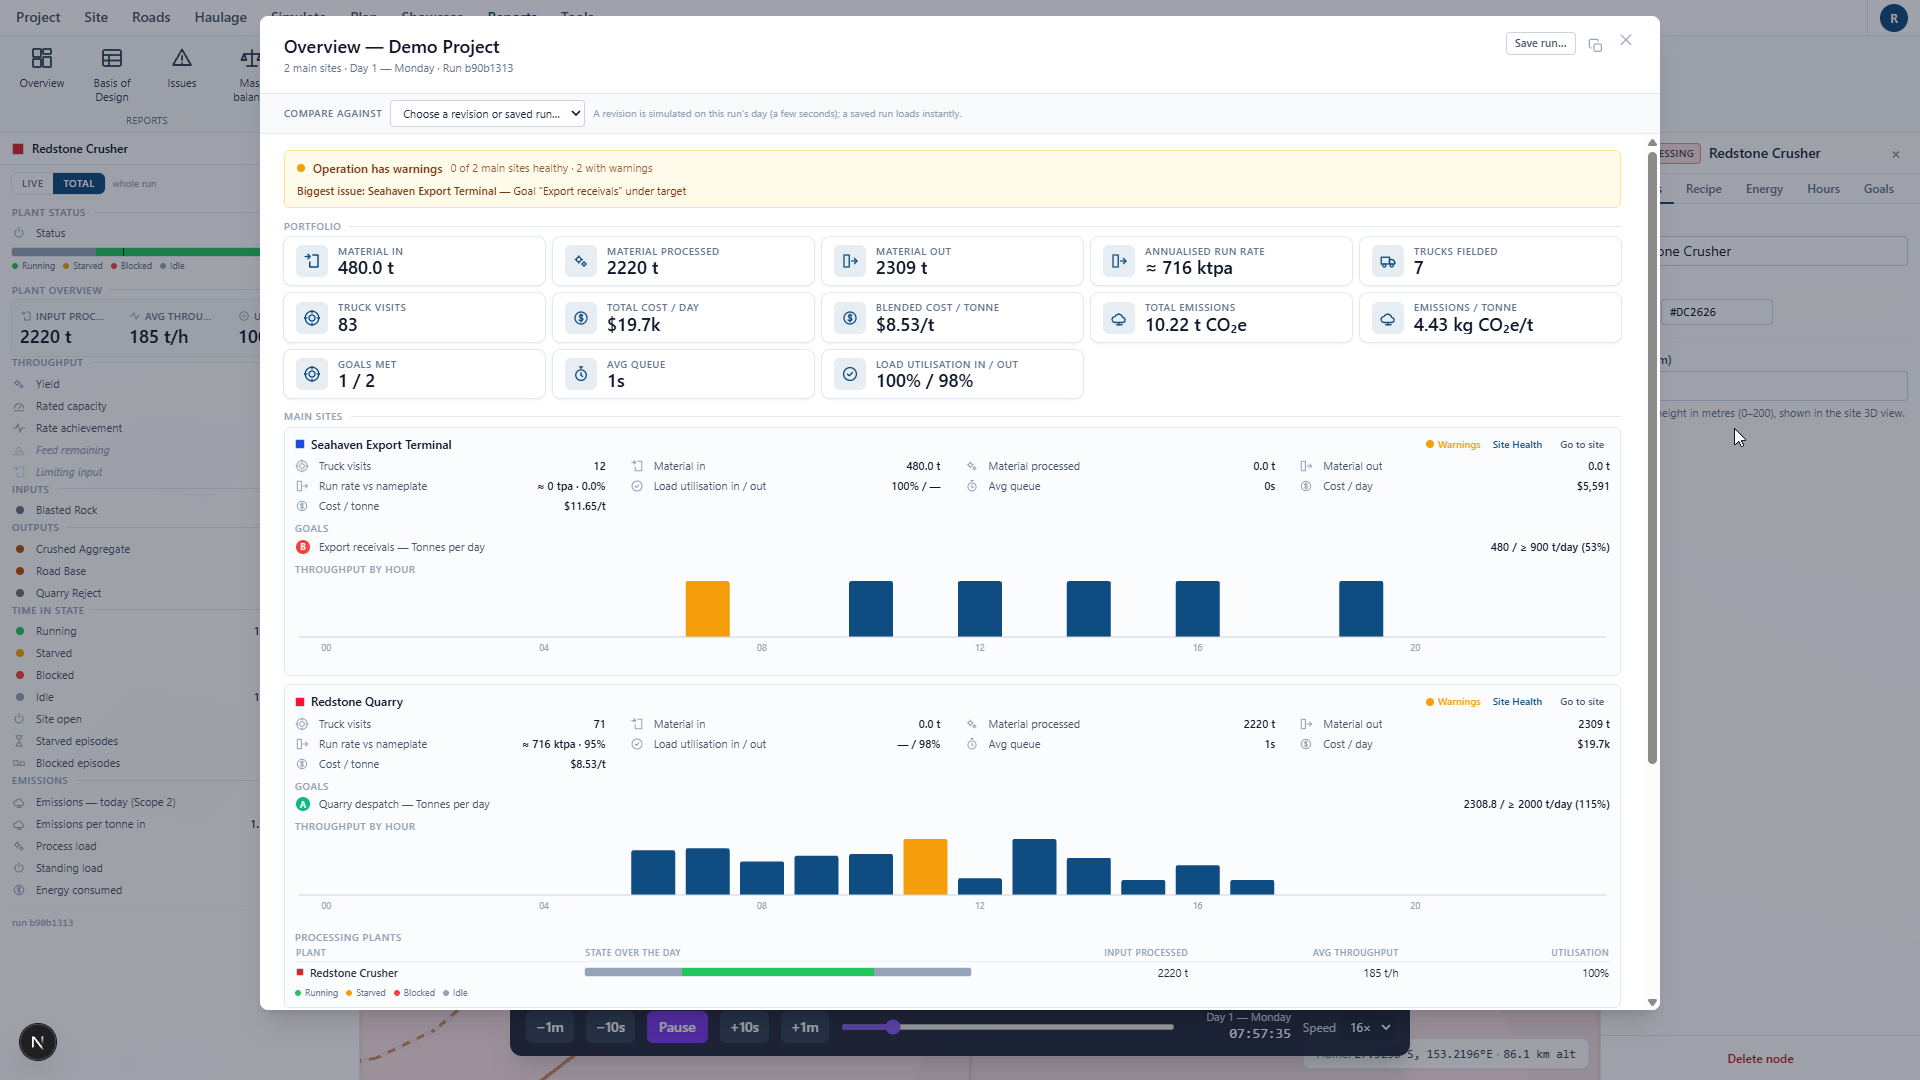
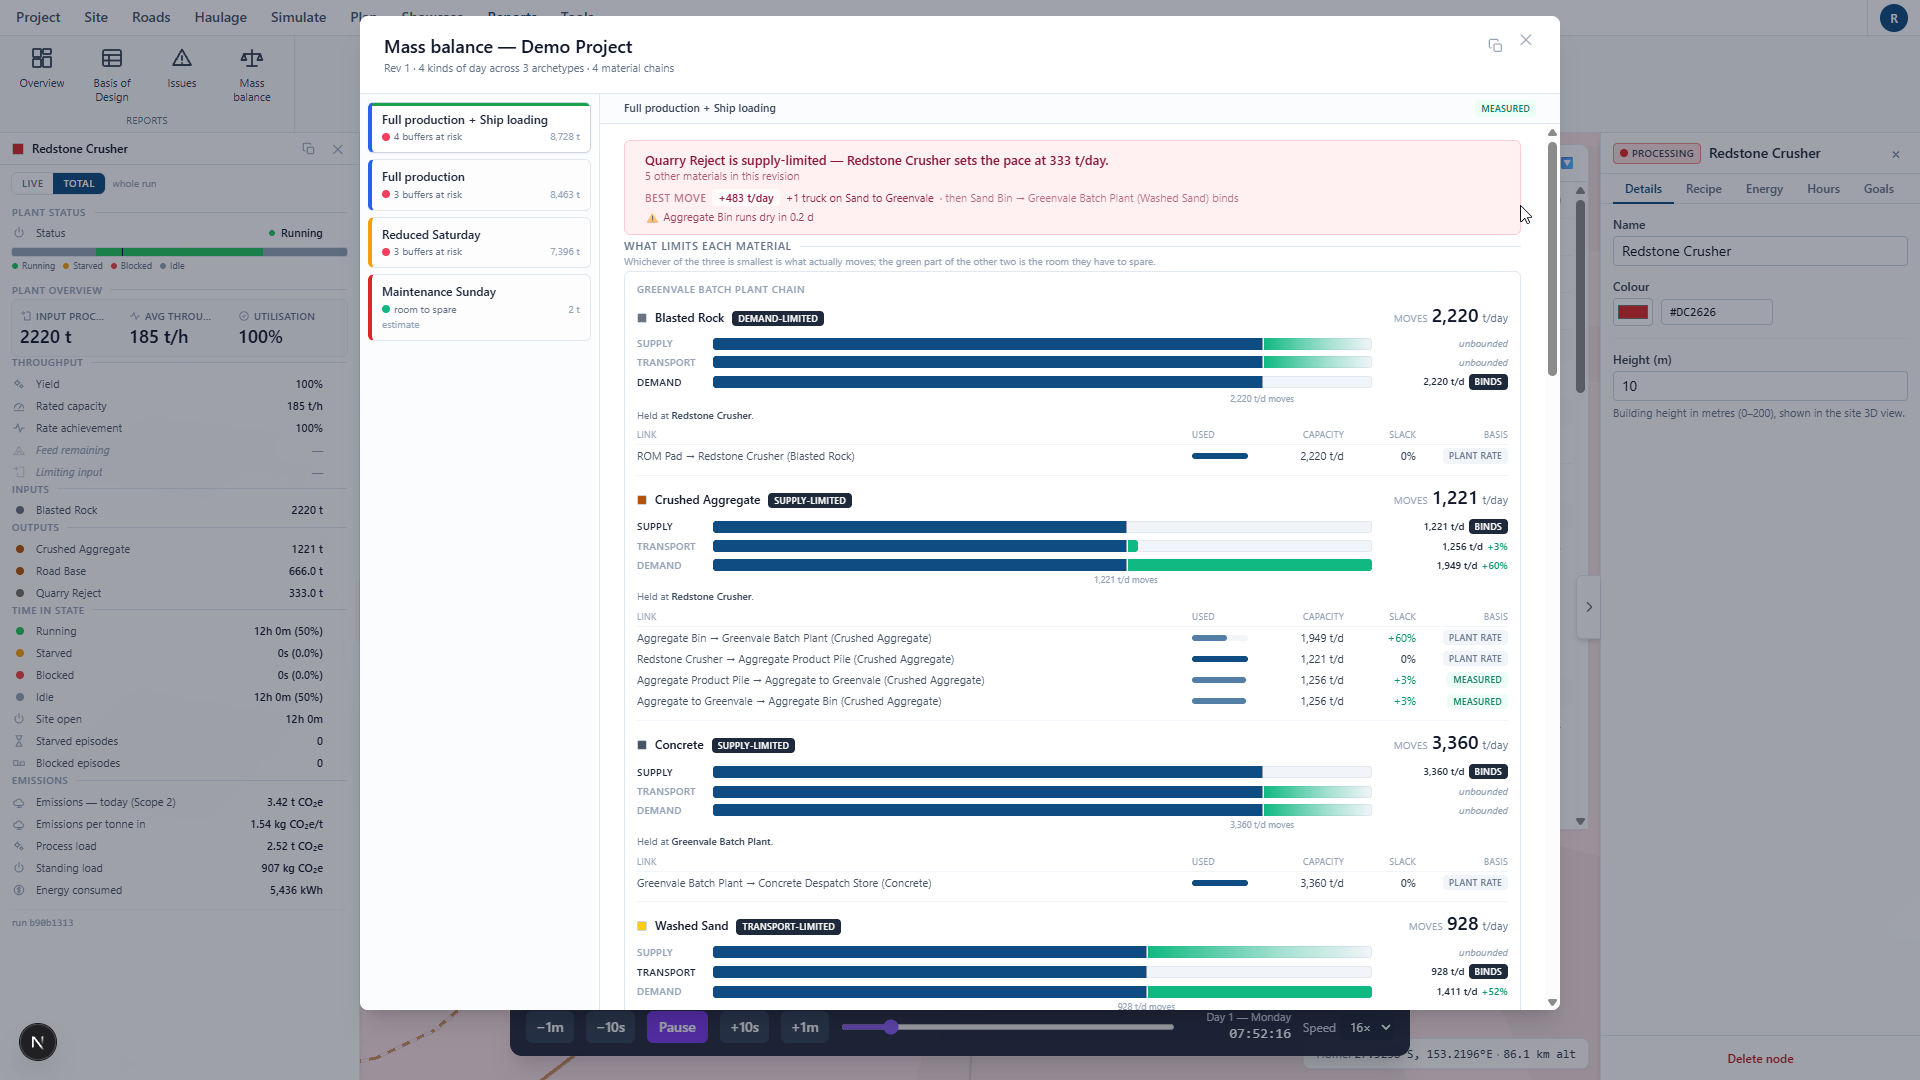
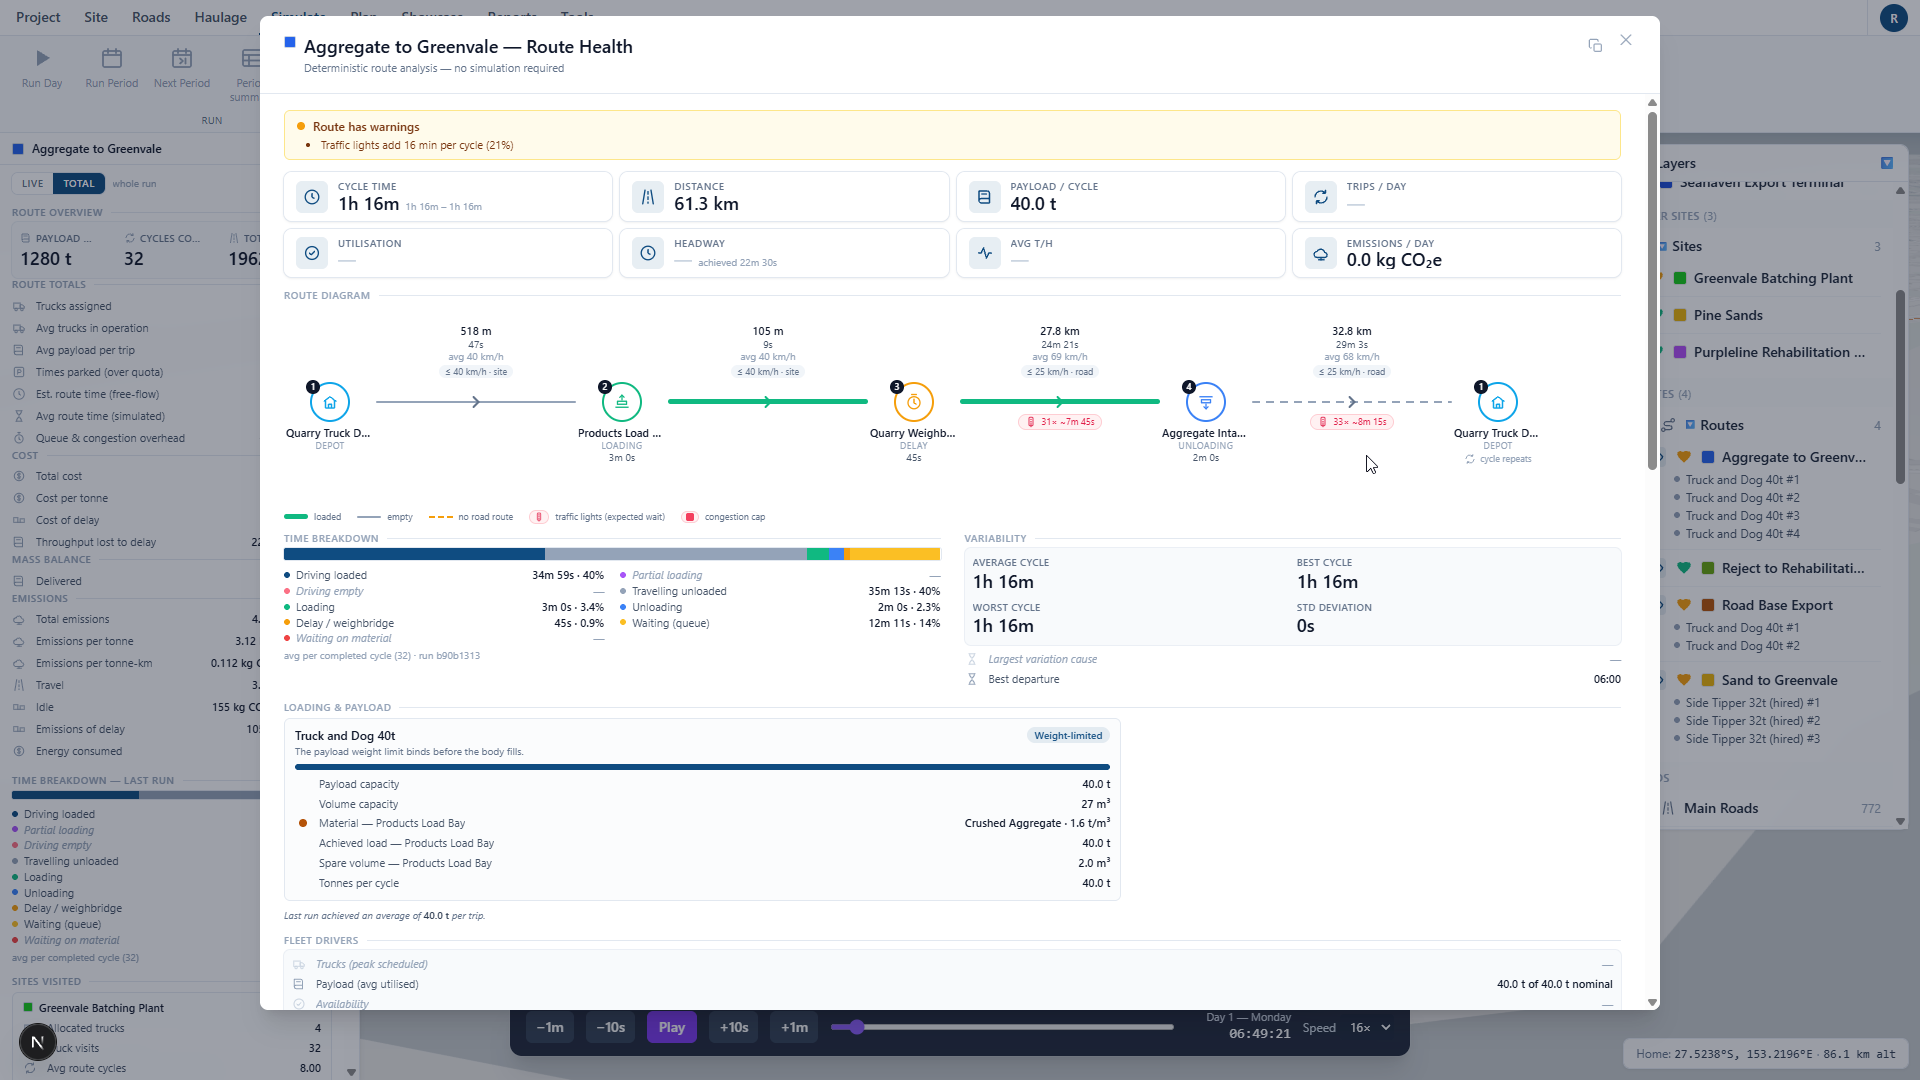
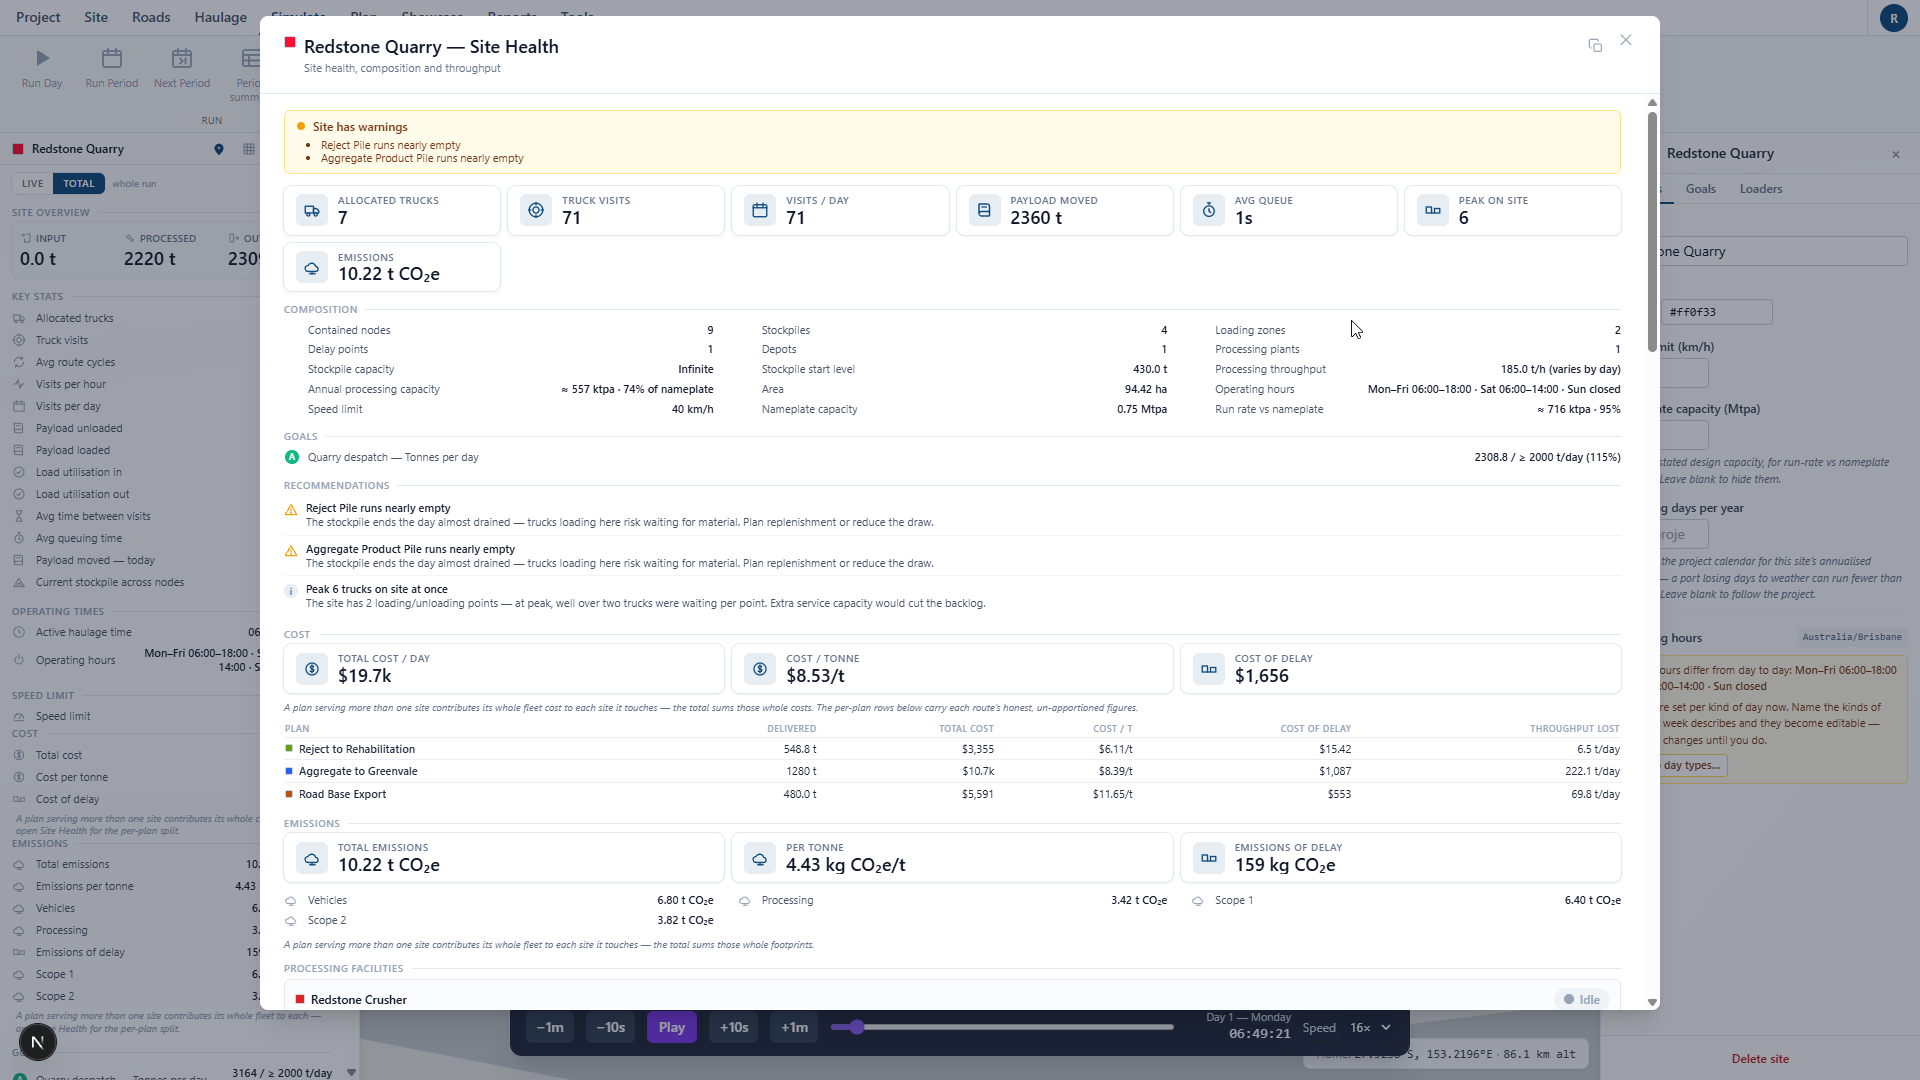
Every run produces a portfolio overview, per-site and per-route health reports, live plant telemetry and a mass balance that identifies the constraint on every material chain, then prices every lever in tonnes per day.
- Operation overview: throughput, cost per tonne, emissions, goals met, truck visits and load utilisation.
- Site and route health: composition, recommendations, cycle breakdowns and where time is lost.
- Mass balance: whichever of supply, transport and demand is smallest is what actually moves.
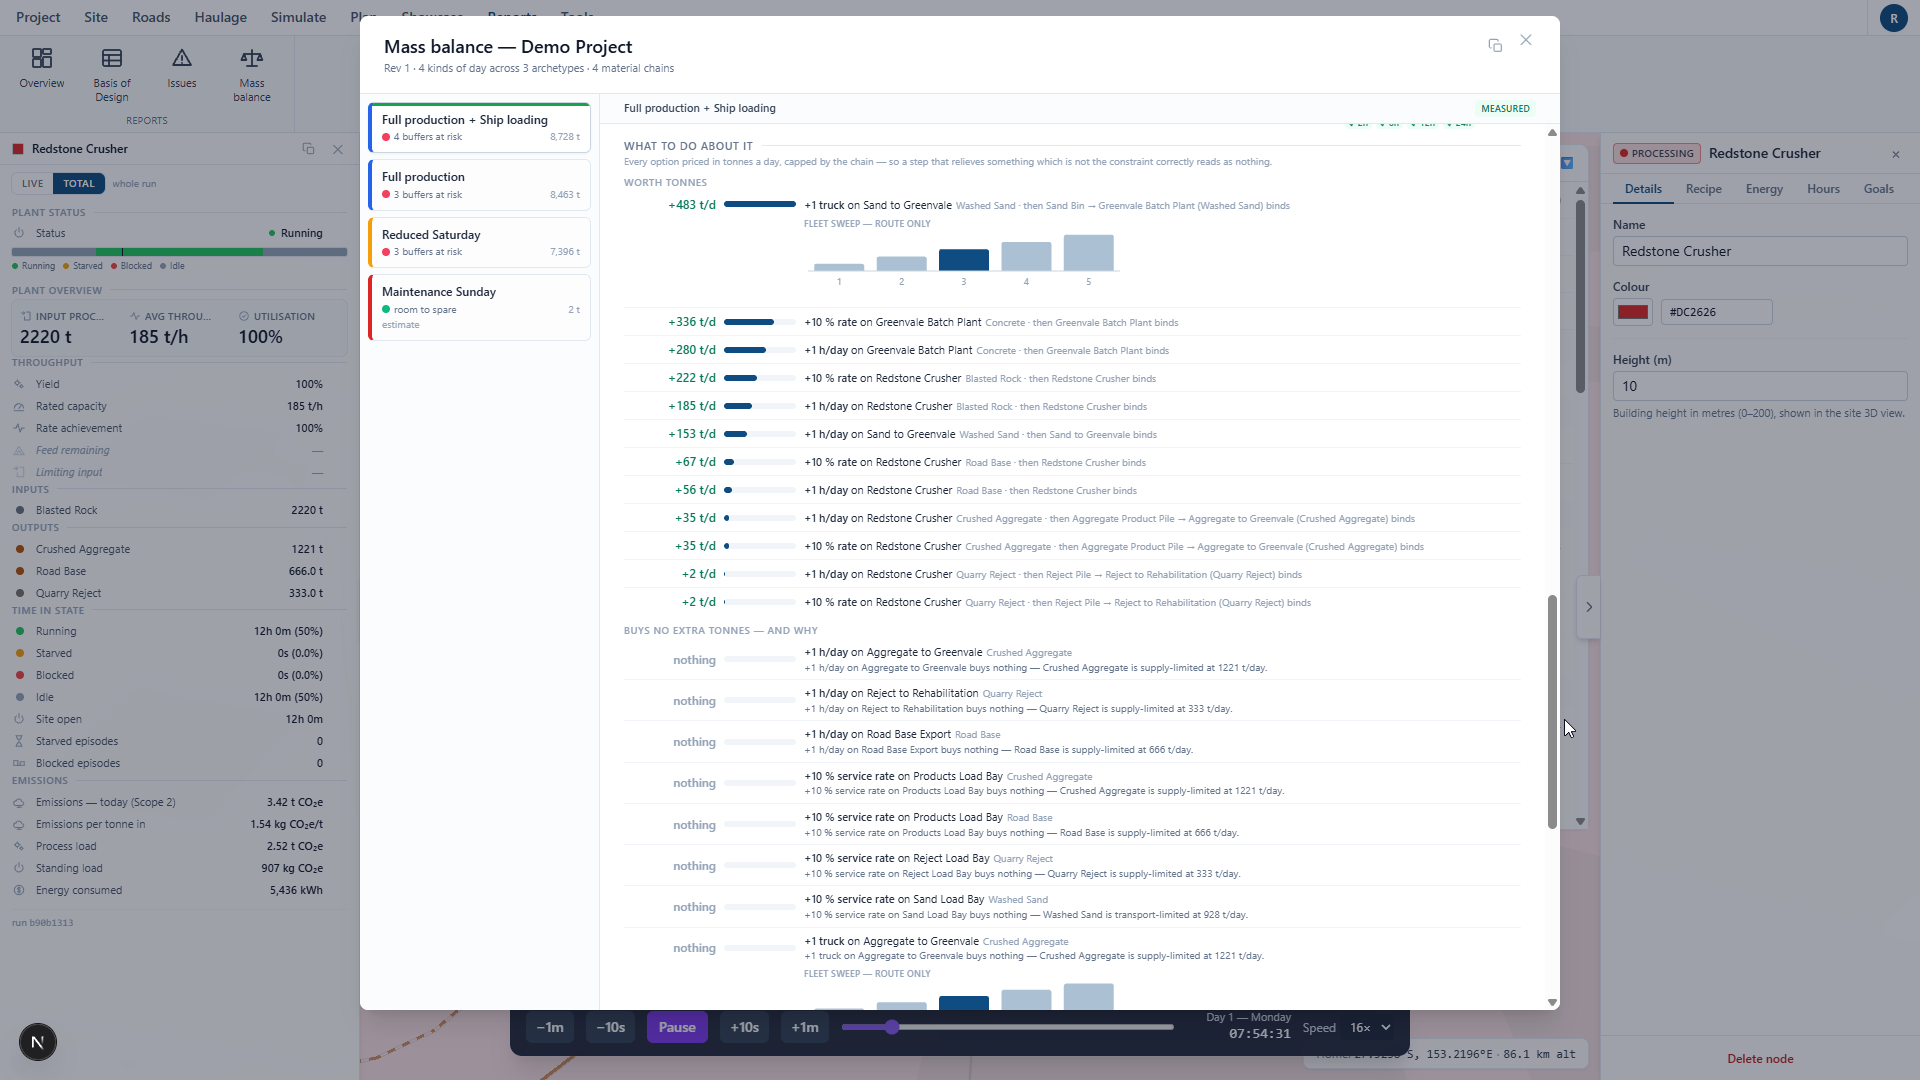
- Every improvement option priced in tonnes per day, including the ones that buy nothing and why.
04 · Plan
From one day to a quarter, and beyond
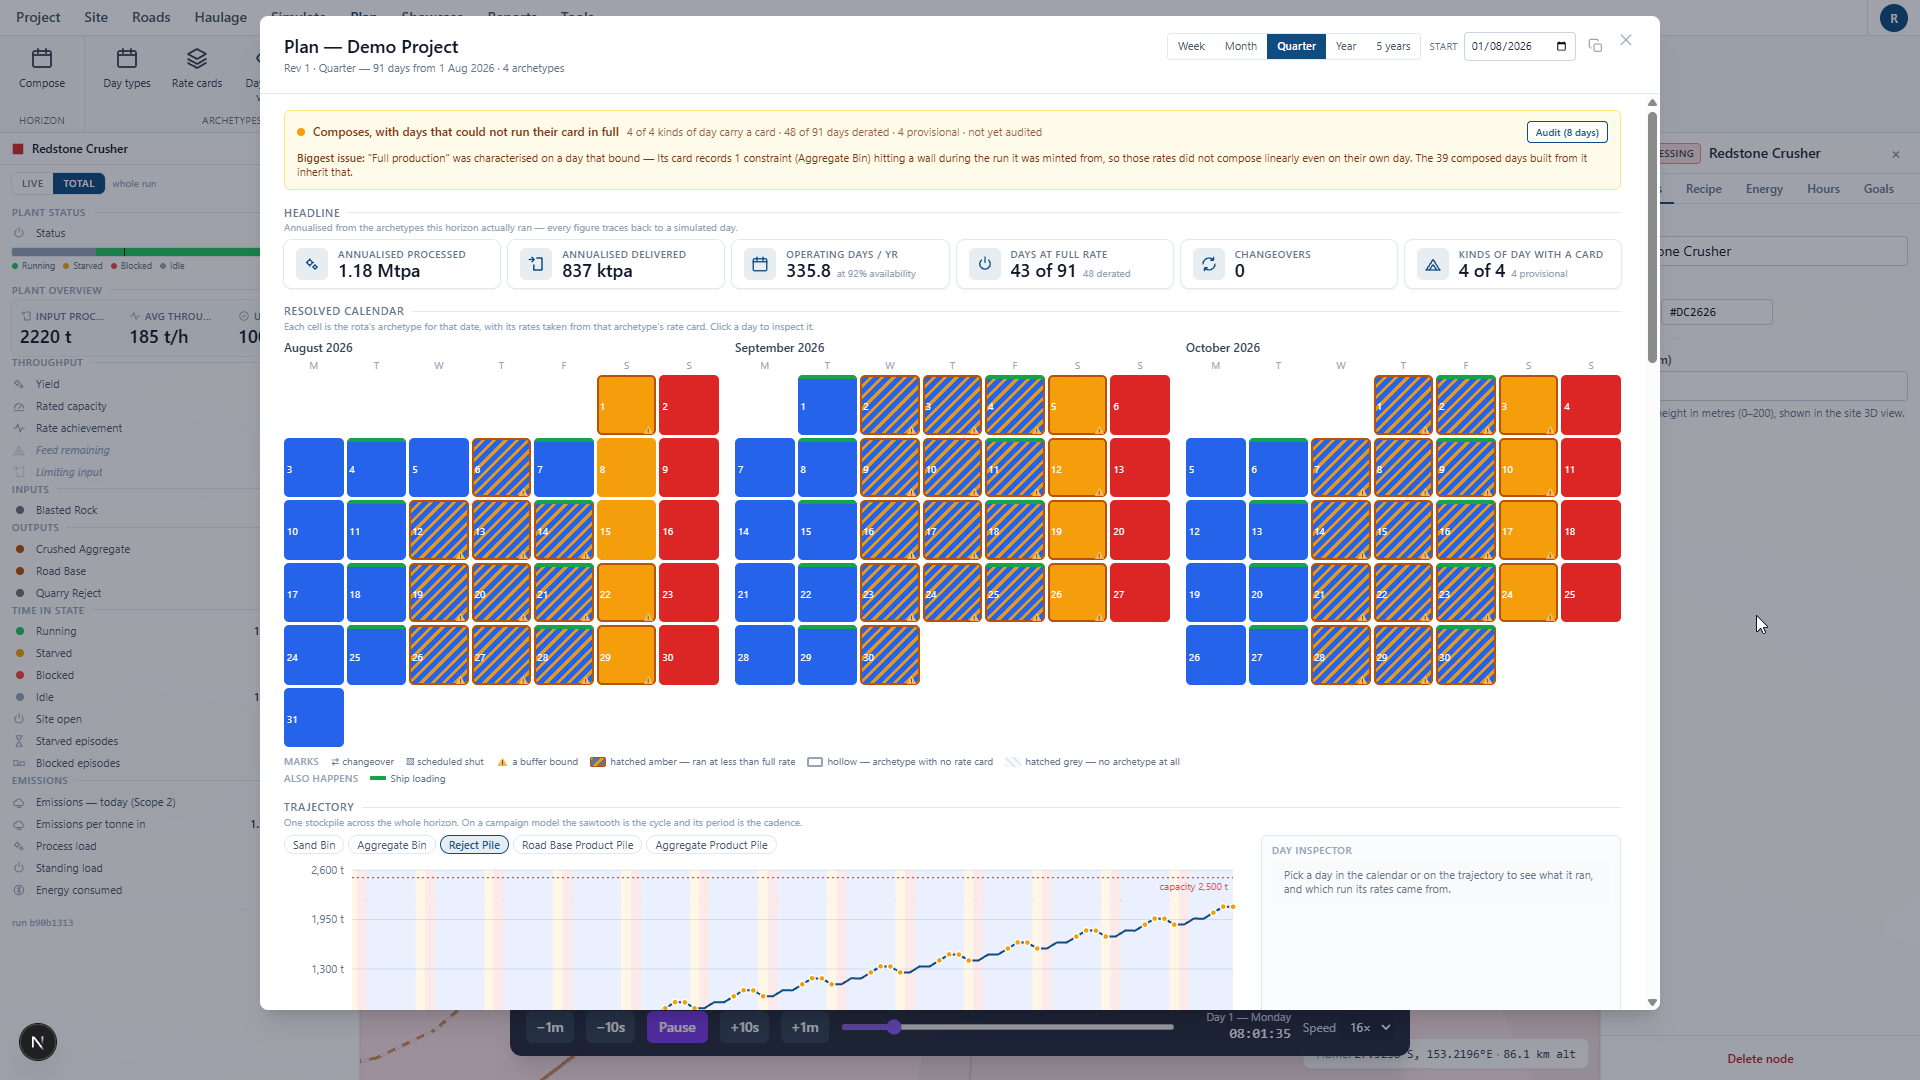
Simulate a period, save it to the plan, and the days after it repeat what its last cycle did. Headline figures annualise from days the simulator actually ran, so every number traces back to a simulated day.
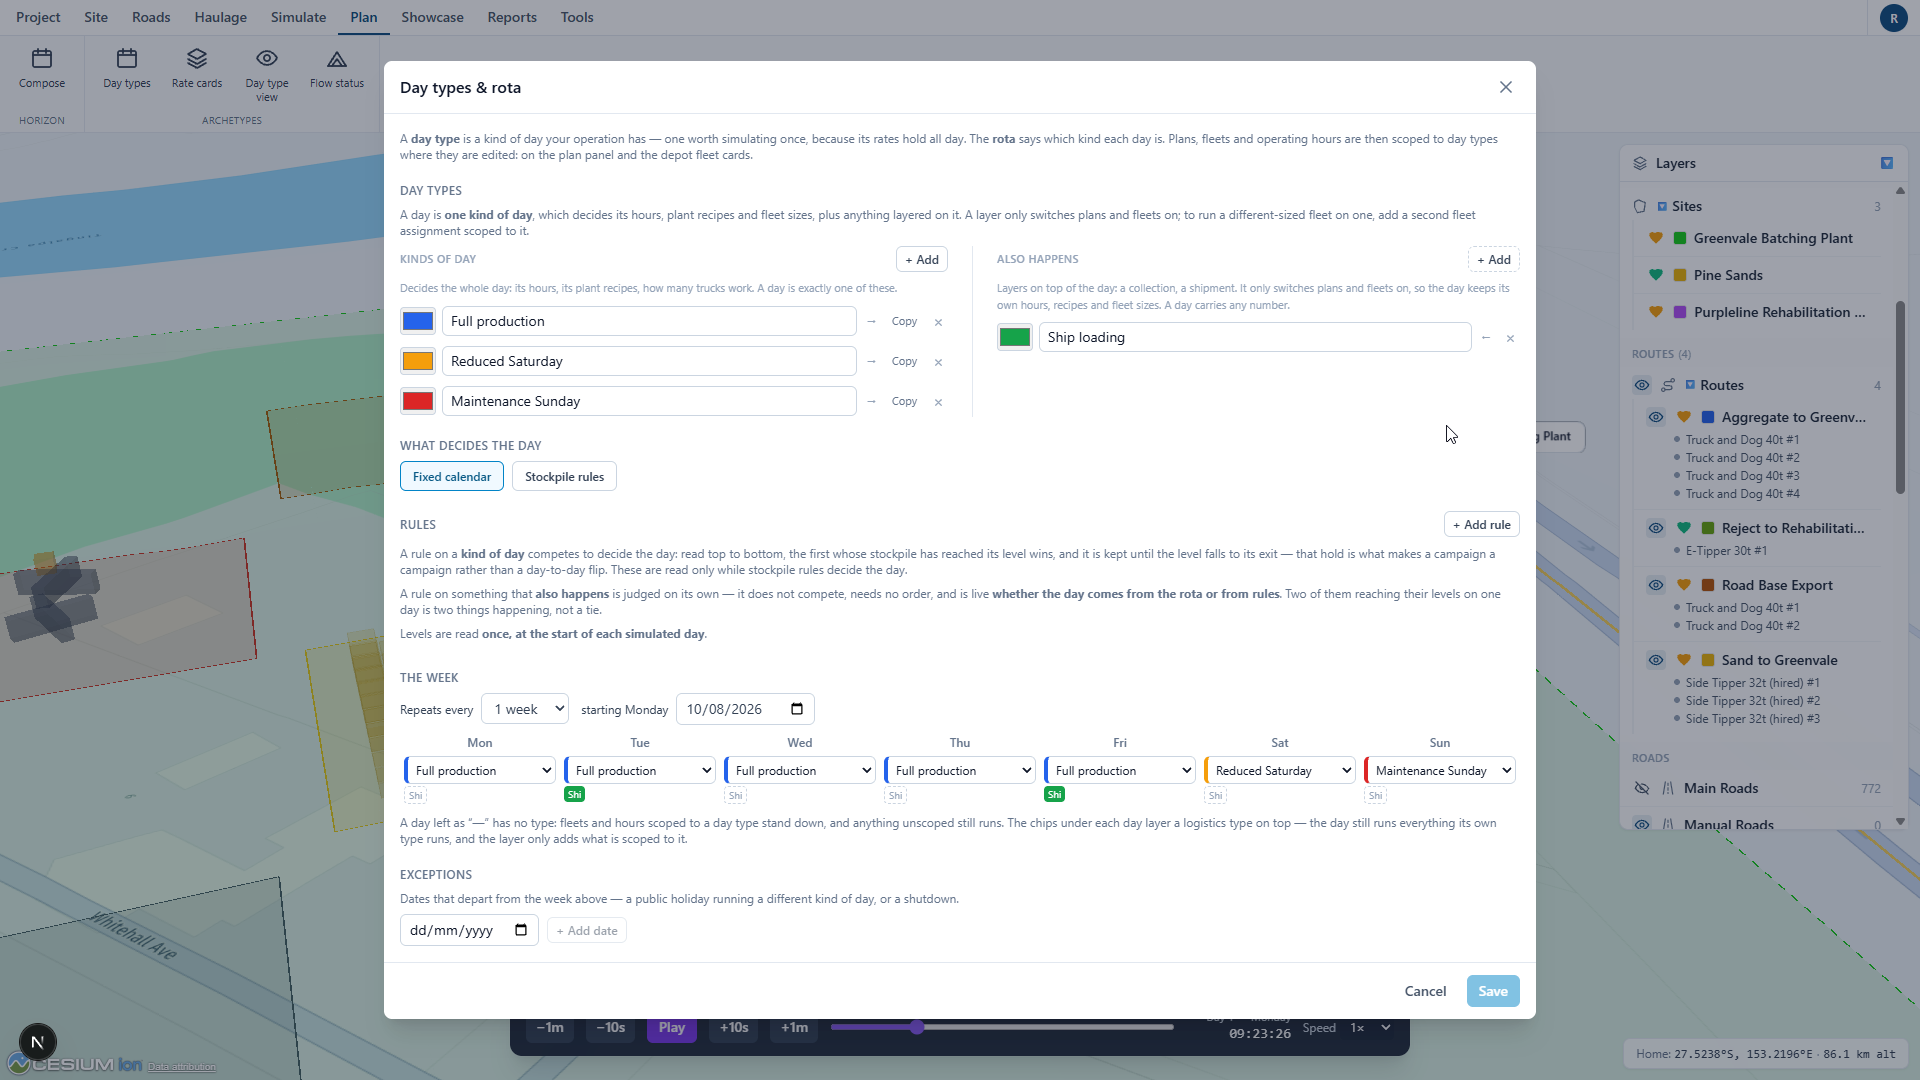
- Day types carry their own hours, plant recipes and fleet sizes; layers add ship loading and campaigns on top.
- A fixed calendar or stockpile rules decide the day; exceptions handle holidays and shutdowns.
- The resolved calendar shows every day of the horizon, flagging the days a stockpile reaches a limit and the kinds of day no simulation covers.
- Stockpile trajectories across the whole horizon show the cycle and its cadence.
See it with your own operation
A first model takes about an hour: draw the site, describe the cycles, run the day.